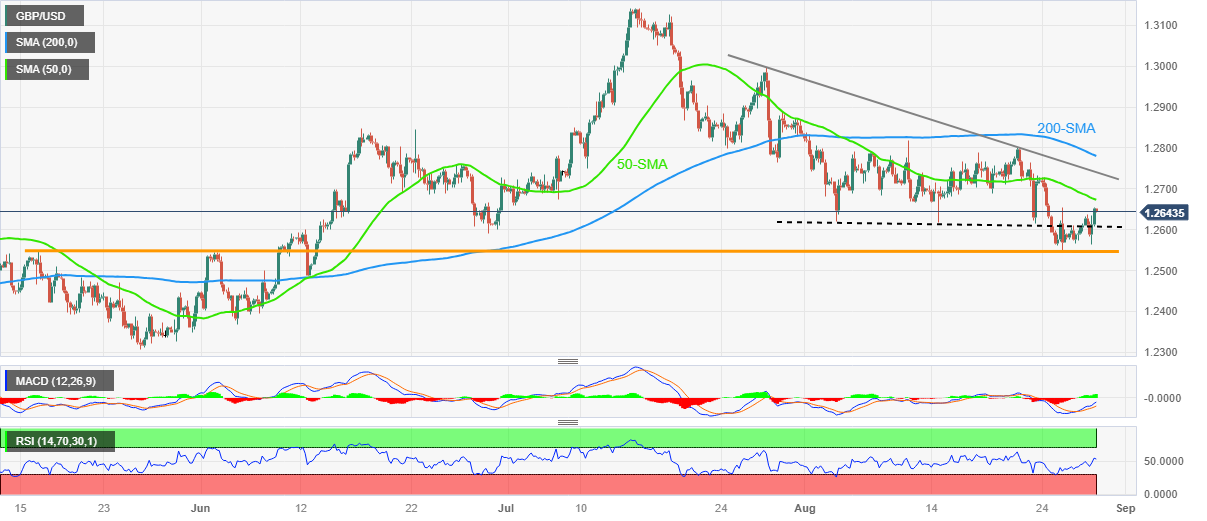
GBP/USD Price Analysis: Pound Sterling portrays pre-data consolidation below 1.2680 hurdle
- GBP/USD buyers seek fresh clues after cheering the biggest daily jump in three weeks.
- Successful rebound from 15-week-old horizontal support, upbeat oscillators keep Cable buyers hopeful.
- 50-SMA will test immediate upside of the Pound Sterling before the key resistance line.
- British Consumer Credit, key US employment, inflation clues eyed for clear directions.
GBP/USD seesaws around 1.2650 after rising the most in three weeks the previous day. In doing so, the Cable pair portrays the market’s cautious mood ahead of a slew of statistics from the UK and the US.
It’s worth noting that the Pound Sterling’s extension of Friday’s rebound from a horizontal support zone comprising the tops marked in May and June, around 1.2550, joins the bullish MACD signals and the upbeat RSI (14) line to keep the buyers hopeful.
However, the 50-SMA level of around 1.2675 will test the GBP/USD pair’s immediate upside ahead of a one-month-old descending resistance line surrounding 1.2740.
In a case where the Cable remains firmer past 1.2740, the 200-SMA level of around 1.2780 and the August 10 peak of near 1.2820 will be on the bull’s radar.
On the flip side, the GBP/USD pair’s pullback may initially aim for the three-week-old support line surrounding 1.2600 before challenging the aforementioned key horizontal trend line comprising levels marked since mid-May, close to 1.2550 at the latest.
Should the Pound Sterling remain weak past 1.2550, the odds of witnessing a quick drop to the mid-June swing low of around 1.2485 can’t be ruled out.
That said, the UK Consumer Credit for July will entertain GBP/USD ahead of the US ADP Employment Change, the final readings of the US second quarter (Q2) Gross Domestic Product (GDP) and the Personal Consumption Expenditure (PCE).
Also read: GBP/USD regains the 100-day SMA as US yields sink
GBP/USD: Four-hour chart

Trend: Further upside expected