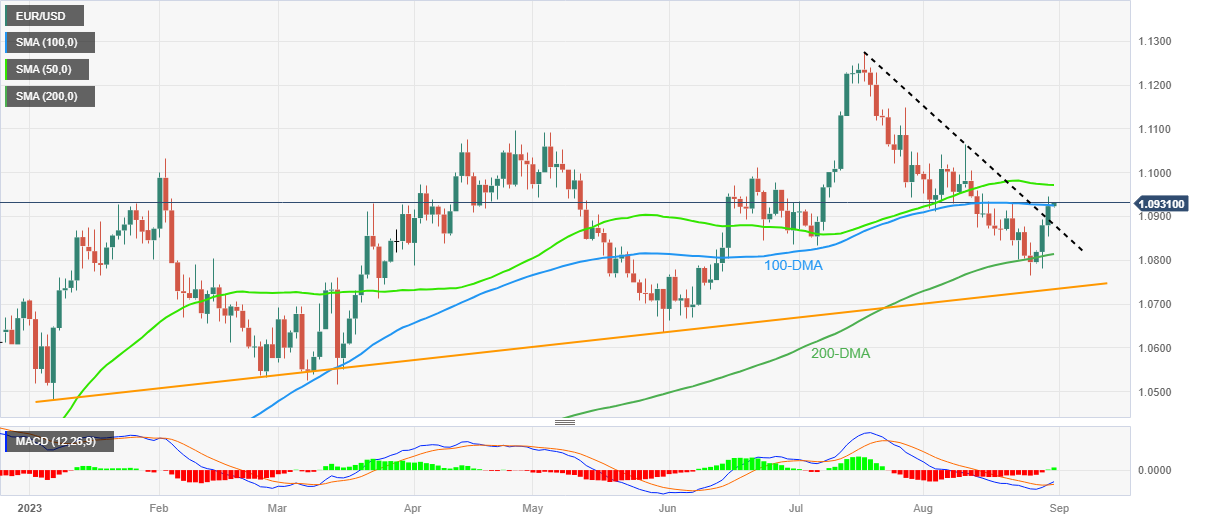
EUR/USD Price Analysis: Euro pierces 100-DMA hurdle ahead of Eurozone, US inflation clues
- EUR/USD remains on the front foot at the highest level in 12 days.
- Clear upside break of six-week-old descending trend line, bullish MACD signals keep Euro buyers hopeful.
- Dovish Fed bias also keeps pair buyers hopeful ahead of Eurozone HICP, CPI and US Core PCE Price Index.
- 50-DMA lures Euro bulls while 200-DMA acts as an additional downside filter.
EUR/USD bulls prod the 100-DMA hurdle while printing the mild gains around a two-week high during early Thursday. In doing so, the Euro pair cheers the broadly downbeat US Dollar amid the dovish Fed bias ahead of the key inflation numbers from the Eurozone and the US. That said, the Euro pair renews its intraday high around 1.0932 by the press time.
Also read: EUR/USD edges higher past 1.0900 as Eurozone, inflation data eyed to confirm Fed, ECB moves
The strongest bullish MACD signal in six weeks joins the aforementioned fundamental catalysts to allow the Euro pair to cross the 100-DMA hurdle surrounding 1.0930 and aim for the 50-DMA resistance of 1.0972. However, the 1.1000 psychological magnet and June high of 1.1012 could challenge the EUR/USD bulls afterward.
In a case where the major currency pair remains firmer past 1.1012, the odds of witnessing another battle with the 1.1100 threshold, previously witnessed in April and May, can’t be ruled out.
Alternatively, a downside break of the previous resistance line stretched from July 18, now immediate support around 1.0880, can recall the EUR/USD sellers.
However, the 200-DMA and an upward-sloping support line from early January, respectively near 1.0815 and 1.0730 will be crucial challenges for the pair bears to conquer afterwards.
EUR/USD: Daily chart
Trend: Further downside expected
