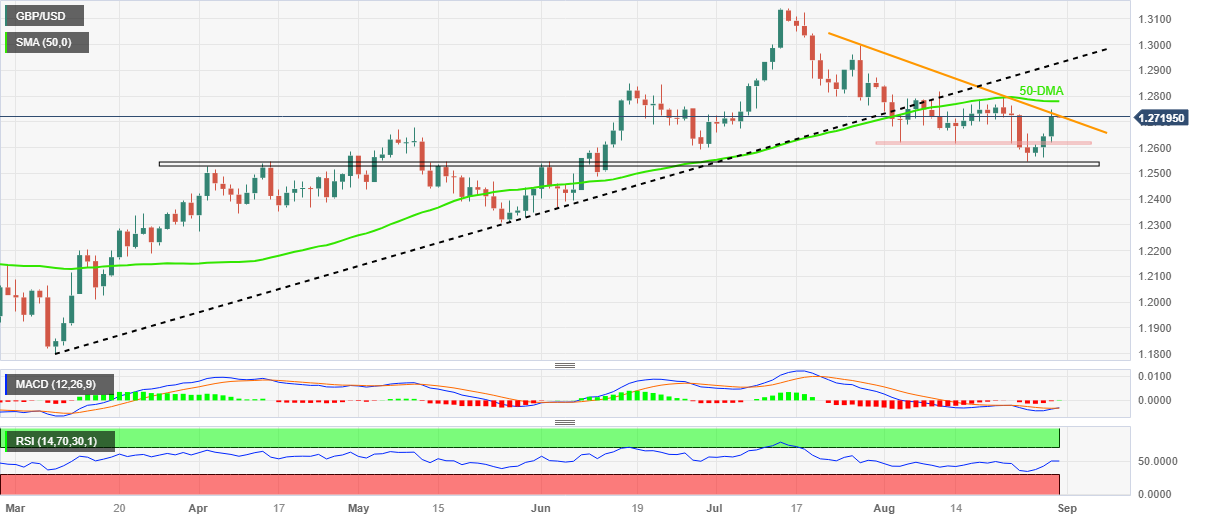
GBP/USD Price Analysis: Cable buyers prod key resistance near 1.2720, Fed inflation eyed
- GBP/USD prods one-month-old descending resistance line at weekly top.
- Looming bull cross on MACD, steady RSI joins higher high formation to favor Cable bulls.
- 50-DMA acts as additional upside filter for the Pound Sterling buyers to cross.
- Pullback needs validation from five-month-old horizontal support zone.
GBP/USD buyers attack a downward-sloping resistance line from late July as they await the key US inflation gauge while pausing the three-day uptrend amid early Thursday morning in Asia. In doing so, the Cable pair seesaws around the 1.2720 level while defending the previous week’s rebound from a five-month-old horizontal support zone.
Not only a clear rebound from the key horizontal support but the impending bull cross on the MACD and the steady RSI (14) line also keep the GBP/USD buyers hopeful.
With this, the Pound Sterling is likely to cross the 1.2720 upside hurdle.
However, the 50-DMA level of 1.2780 acts as the last defense of the GBP/USD bears before giving control to the buyers.
Following that, a run-up towards the previous support line stretched from early March, close to 1.2930, and then to the 1.3000 psychological magnet can’t be ruled out.
On the flip side, the GBP/USD pair’s pullback may aim for the monthly horizontal area surrounding 1.2620–15 before revisiting the horizontal area comprising multiple levels marked since early April, close to 1.2545–30.
In a case where the Cable pair drops below 1.2530, it becomes vulnerable to decline toward May’s bottom of around 1.2310.
GBP/USD: Daily chart

Trend: Further upside expected