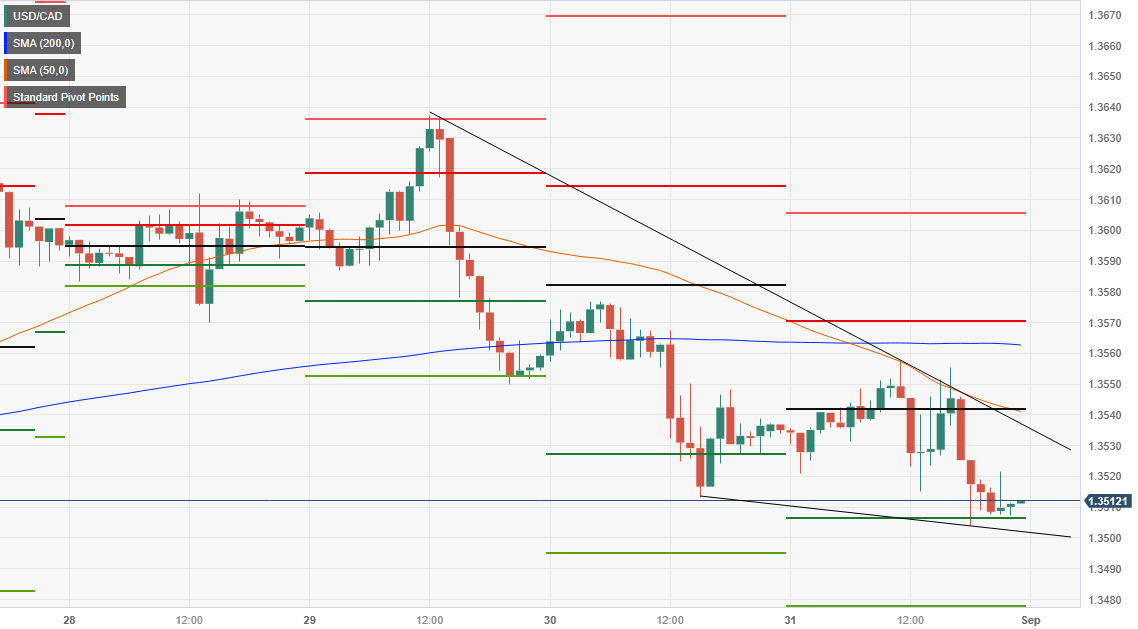
USD/CAD Price Analysis: Stays afloat above 1.3500 despite high oil prices
- USD/CAD trades nearly flat at 1.3510 as the Asian session begins, despite the US Dollar gaining against most G10 currencies.
- Falling US Treasury bond yields and a surge in oil prices support the Canadian Dollar.
- From a technical standpoint, the pair remains neutral to upward biased but is on the brink of breaking its uptrend, putting the 200-DMA at 1.3461 in focus.
The Canadian Dollar (CAD) remains in charge against the US Dollar (USD) even though the latter appreciated against most G10 FX currencies across the board. However, falling US Treasury bond yields and a jump in oil prices benefitted the CAD. Hence, the USD/CAD is trading at 1.3510, almost flat as the Asian session commences.
USD/CAD Price Analysis: Technical outlook
From a daily chart perspective, the USD/CAD remains neutral to upward biased, as the pair is still above the latest higher low achieved on August 21 at 1.3496, but at the brisk of breaking an uptrend market structure, that would expose the 200-day Moving Average (DMA) at 1.3461. Nevertheless, sellers must achieve a daily close below 1.3496 to remain hopeful of achieving lower lows, as the 50-DMA slope is trending up.
From an intraday standpoint, the pair broke below the August 24 daily ow of 1.3509, putting in play the 1.3500 figure. But one of the latest three candlesticks of August 31 price action drawing a larger wick on the bottom of the body suggests buyers entering the market around the 1.3500 area. Nevertheless, the USD/CAD is downward biased. First support emerges at 1.350, followed by the S1 daily pivot at 1.3488. A breach of the latter will expose the S2 pivot point at 1.3469 before diving to 1.3450. On the flip side, the first resistance would be the daily pivot point at 1.3523, followed by the 50-hour Moving Average (HMA) at 1.3540, before reaching the R1 pivot.
USD/CAD Price Action – Hourly chart
