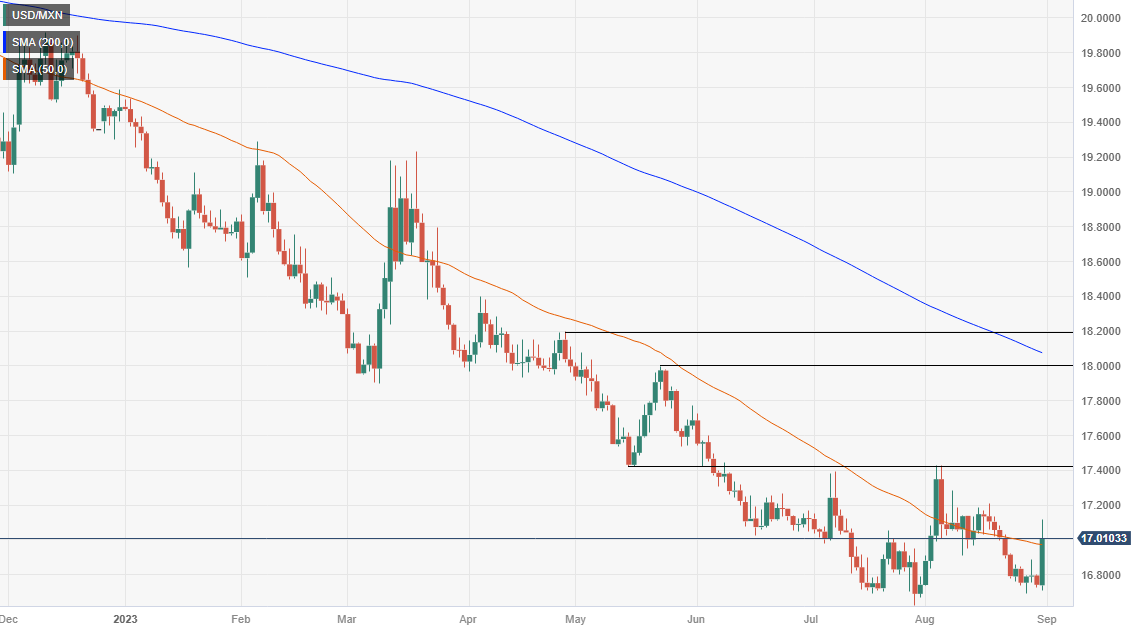
USD/MXN rallies to 17.0000 on month-end flows, Banxico news
- USD/MXN trades around 17.00, up significantly from a daily low of 16.7083, as month-end flows and mixed US economic data favor the Greenback.
- Banxico announces the winding down of its hedge program settled in Mexican Pesos, adding fuel to the USD/MXN rally; traders eye a daily close above 17.0000.
- Banxico Governor Victoria Rodriguez Ceja rules out rate cuts and raises Mexico’s 2023 growth estimates, while Atlanta’s Fed President Raphael Bostic comments on US inflation policy.
The Mexican Peso (MXN) plunged more than 1.62% against the US Dollar (USD) late in the New York session due to month-end flows favoring the USD, mixed US data, as well as Bank of Mexico (Banxico) news. Therefore, the USD/MXN is trading at 17.0079 after hitting a daily low of 16.7083.
Mexican Peso drops over 1.60% vs. USD amid mixed US data, Banxico’s decision to wind down hedge program
Wall Street trades mixed as investors brace for August’s Nonfarm Payrolls report release. Analysts estimate the US economy added 170K jobs, 17K less than July’s data, while Average Hourly Earnings are foreseen at 4.4% YoY, unchanged. Later in the day, the Institute for Supply Management (ISM) will reveal the Manufacturing PMI, estimated at 47, above July 46.4, with most subcomponents seen increasing except for the employment index.
Aside from this, the US economic agenda on Thursday revealed the Federal Reserve’s preferred gauge for inflation, the Personal Consumption Expenditure (PCE), was 3.3% YoY, as expected, but exceeded June’s 3%. Core PCE, sought by Fed members as its focal point, is stickier than what policymakers were projecting, stands at 4.2% YoY as foreseen but above the previous month’s 4.1%. At the same time, the unemployment claims came below estimates of 235K, at 229K, contrary to earlier data revealed during the week, that underscored the labor market was losing traction.
That said, the USD/MXN edged higher, not only on US data. Banxico reported that it’s winding down its hedge program settled in Mexican Pesos.
The exotic pair rallied sharply and touched a daily high of 17.1114 before reversing its course below the 17.0000 mark. However, traders are eyeing a daily close above 17.0000, with USD/MXN buyers setting their sights on the 100-day Moving Average (DMA) at 17.3072.
In the meantime, the US Dollar Index, which measures the buck’s value against a basket of six currencies, rises by 0.41%, at 103.606. US Treasury bond yields and worldwide remain depressed as traders prepare for Friday’s Nonfarm Payrolls report.
Aside from this, Banxico’s Governor Victoria Rodriguez Ceja took off from the table rate cuts, as she added, “The outlook ahead continues to be complex and uncertain. It’s important to remember that disinflation periods are not linear.” Should be said, Banxico raised growth estimates for Mexico’s economy in 2023 to 3%, above the previous estimate of 2.3%.
On the central bank front, Atlanta’s Fed President Raphael Bostic said the policy was appropriately restrictive to bring inflation towards the US central bank’s 2% target over a “reasonable” period.
USD/MXN Price Analysis: Technical outlook
After the USD/MXN breached the 50 and 20-DMAs, the pair must clear resistance levels if buyers want to regain control. A daily close above 17.0000 could spur a rally toward the August 17 high of 17.2073. A breach of the latter would expose the May 17 daily low, at 17.4038, seen as a crucial level for traders. Once cleared, the USD/MXN would achieve successive series of higher highs and lows, opening the door to test the 200-(DMA) at 18.0671.
