GBP/USD Price Analysis: Cable bears eye 1.2570 support and BoE Monetary Policy Report Hearings
- GBP/USD stays pressured towards the key support line after unimpressive rebound.
- Downbeat oscillators, sustained trading below 100-EMA keep Cable bears hopeful.
- Pound Sterling buyers need validation from five-week-old falling resistance line.
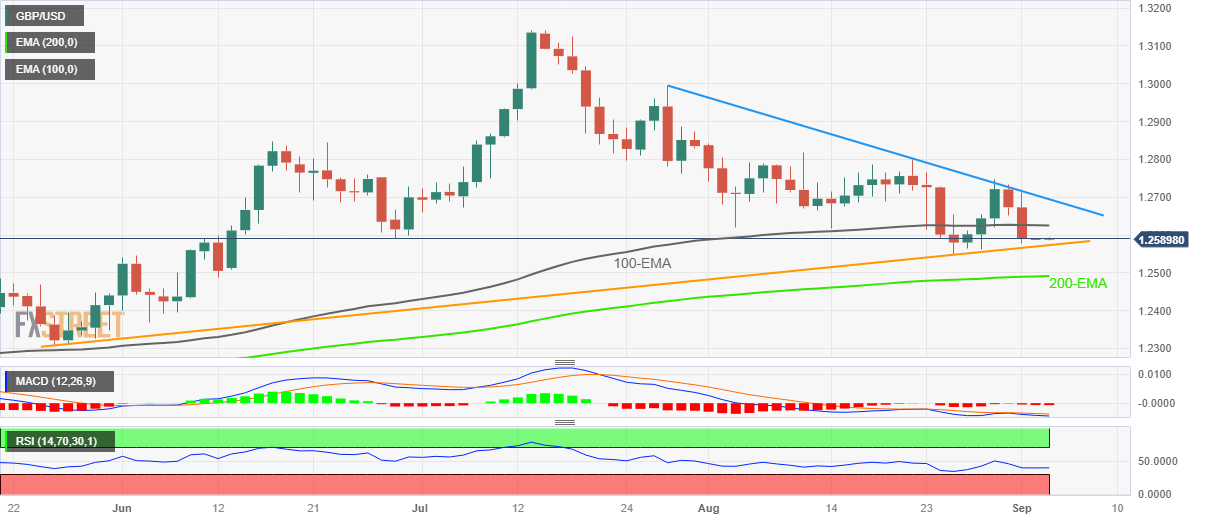
GBP/USD remains on the back foot around 1.2590-85 as it struggles to defend the weekly gain during the early hours of Monday’s Asian session. In doing so, the Cable pair remains below the 100-bar Exponential Moving Average (EMA).
Adding strength to the downside bias are the bearish MACD signals and a downbeat RSI (14) line, not oversold.
However, the Pound Sterling sellers need validation from an upward-sloping support line from late May, around 1.2570 by the press time.
Also acting as the downside filter is the previous monthly low of around 1.2550 and the 200-EMA level of 1.2490.
In a case where the GBP/USD bears keep the reins past 1.2490, the odds of witnessing a slump toward May’s low of around 1.2310 can’t be ruled out.
On the flip side, a daily closing beyond the 100-EMA level of 1.2625 isn’t enough to recall the GBP/USD buyers as a downward-sloping resistance line from late July, close to the 1.2700 round figure by the press time, holds the key for the fresh long positions. Following that, June’s high of around 1.2850 will be in the spotlight.
Apart from the stated support line, the Bank of England’s (BoE) Monetary Policy Report Hearings will also be important to watch for the GBP/USD pair traders for clear directions.
Also read: GBP/USD Weekly Forecast: Technical setup favors Pound Sterling sellers
GBP/USD: Daily chart

Trend: Further downside expected