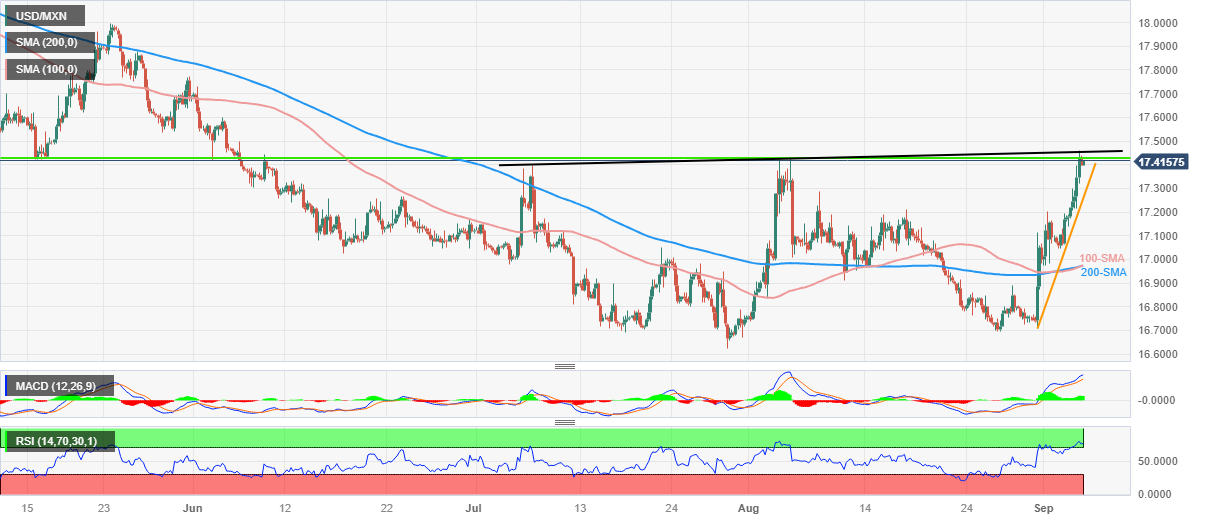
USD/MXN Price Analysis: Mexican Peso retreat appears fading near 17.45 key technical level
- USD/MXN braces for the second consecutive weekly loss as bulls prod key resistance lines.
- Overbought RSI conditions suggest a pullback towards weekly support trend line.
- Convergence of 100-SMA, 200-SMA puts a floor under Mexican Peso price ahead of US ISM Services PMI.
USD/MXN bulls struggle to keep the reins at a three-month high marked the previous day even as the Mexican Peso (MXN) pair edges higher to around 17.42 during early Wednesday.
That said, the quote rose to the highest level since June while fueling the pair toward marking the second consecutive weekly gain amid broad US Dollar strength. However, the overbought RSI and the USD/MXN pair’s failure to provide a daily closing beyond the key technical resistances suggest a pullback in the prices.
Among them, a horizontal line comprising multiple levels marked since mid-May and a two-month-old ascending trend line, respectively around 17.42 and 17.45, gain major attention.
In a case where the USD/MXN pair rises past 17.45, the late May swing high of around 17.76 could act as an intermediate halt during the likely run-up towards the 18.00 threshold.
Meanwhile, pullback moves remain elusive unless breaking an ascending support line from August 31, close to 17.25 by the press time.
Following that, a slew of tops marked in August may test the USD/MXN bears near 17.22 and 17.20 ahead of highlighting the convergence of the 100 and 200 SMAs, close to 16.97 at the latest.
USD/MXN: Four-hour chart

Trend: Pullback expected