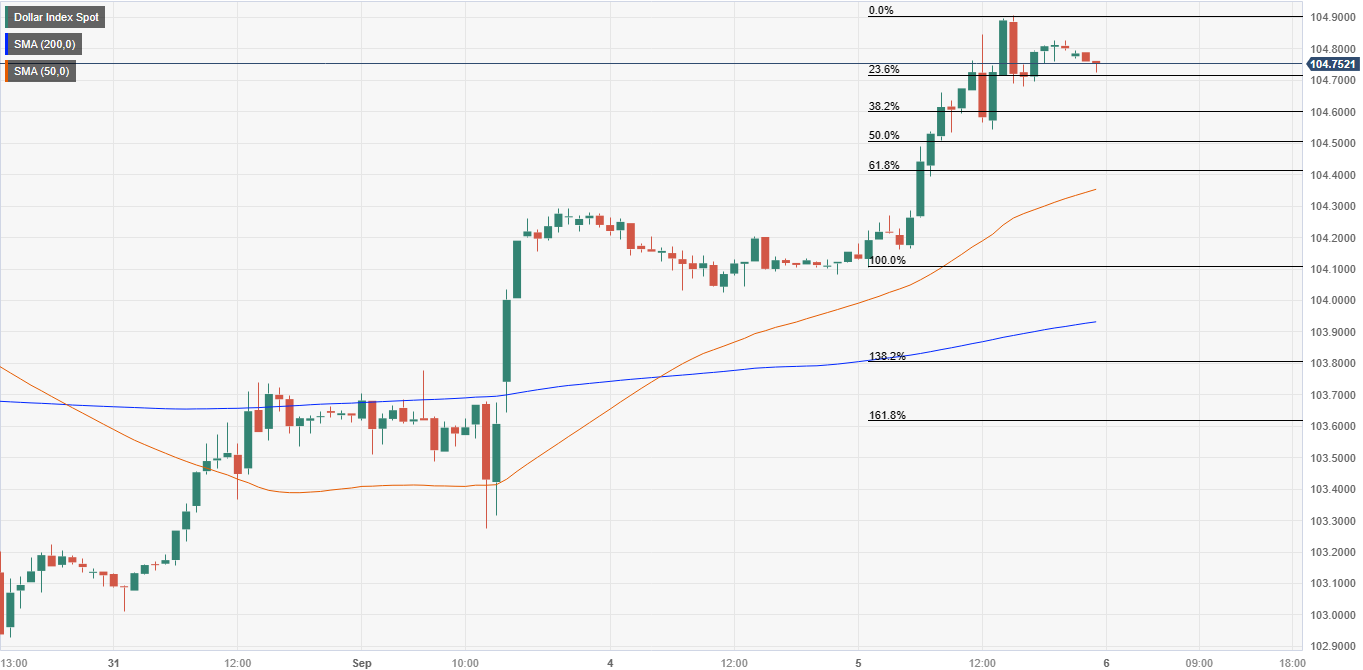
US Dollar Index: Hits five-month high near 105.000, eyes YTD levels
- The US Dollar Index (DXY) gains 0.60% to trade at 104.789, breaking past the 104.000 mark to hit a new five-month high.
- From a daily chart perspective, the DXY shows an upward bias after crossing the 200-day Moving Average at 103.033, with eyes on reclaiming the year-to-date high at 105.882.
- Short-term analysis suggests the DXY needs to clear 104.900 to aim for 105.000, while a recent lower high could signal the potential for a pullback.
The US Dollar Index (DXY) measures the Greenback’s performance against a basket of six currencies, extends its gains past the 104.000 figure, and hit a five-month new high at 104.907. As the Asian session begins, the DXY trades at 104.789 and gains 0.60%.
DXY Price Analysis: Technical outlook
From a daily chart perspective, the DXY is upward biased after it cracked the 200-day Moving Average (DMA) at 103.033. However, to further cement its upward bias, the DXY must reclaim the year-to-date (YTD) high at 105.882, which would expose the 106.000 mark. A breach of that level would expose the November 30 daily high at 107.195 before rallying towards 107.993, at March’s 21 high. Conversely, if the Greenback drops below 104.699, that would pave the way for a correction, targeting the 200-DMA.
Short-term, the DXY remains upward biased, but it needs to clear the 104.900 area so it can threaten to conquer 105.000. Recently, it achieved a lower high, which could pave the way for a pullback. Suppose the DXY retreats below the 23.6% Fibonacci retracement at 104703. In that case, the next support emerges at the 38.2% Fibonacci level at 104.574, confluence with the intermediate level seen on Tuesday at 104.543, followed by the 50-hour Simple Moving Average (HSMA) at 10.333.
DXY Price Action – Hourly chart
