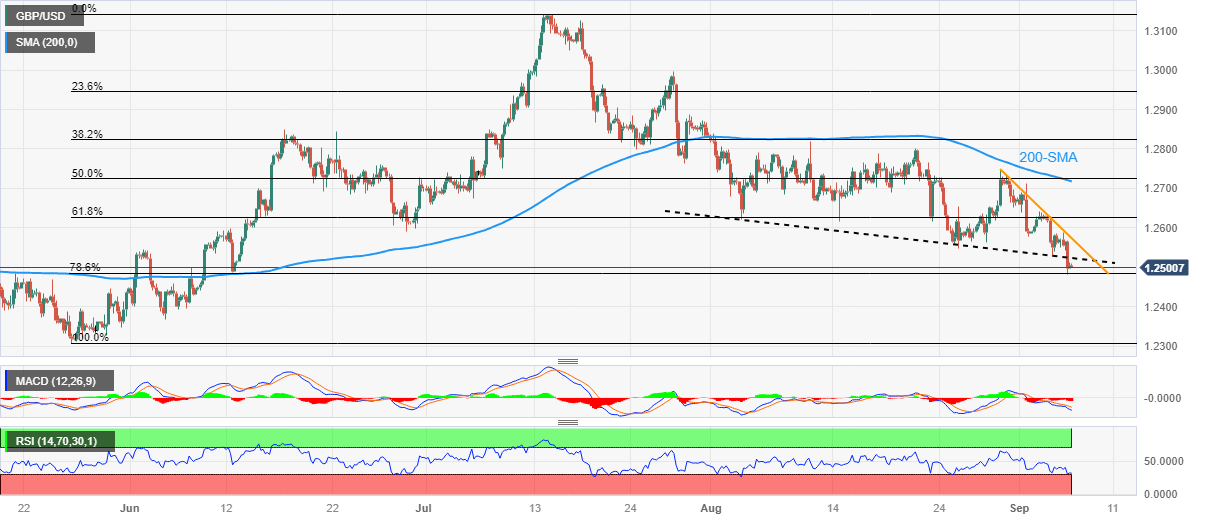
GBP/USD Price Analysis: Bounces off 78.6% Fibonacci ratio, focus on 1.2530 support-turned-resistance
- GBP/USD licks its wounds at three-month low, consolidating recent losses from 78.6% Fibonacci ratio.
- Oversold RSI adds strength to corrective bounce toward previous support line from early August.
- 200-SMA holds the key to Pound Sterling buyer’s conviction.
GBP/USD portrays a corrective bounce off a three-month low to around 1.2500 amid early Thursday morning in Asia. In doing so, the Cable pair justifies the oversold RSI conditions, as well as the Pound Sterling’s sustained rebound from the 78.6% Fibonacci retracement of late May to mid-March upside, near 1.2485.
Even so, the bearish MACD signals and the support-turned-resistance stretched from early August guard immediate recovery of the Pound Sterling pair around 1.2530.
Following that, a one-week-old descending resistance line surrounding 1.2580 will precede the 200-SMA hurdle of around 1.2720 to act as the final defense of the GBP/USD pair sellers.
Alternatively, a daily closing beneath the 78.6% Fibonacci retracement level of 1.2485 could quickly drag the GBP/USD pair’s low marked in June around 1.2370, a break of which will direct the Cable bears toward the yearly low marked in March around 1.1800.
That said, the 1.2000 psychological magnet acts as the intermediate halt between 1.2370 and 1.1800.
Overall, the GBP/USD pair is likely to witness a corrective bounce but the room towards the north is long and bumpy.
On a fundamental side, comparatively more hawkish Federal Reserve (Fed) talks than their Bank of England (BoE) counterparts keep exerting downside pressure on the GBP/USD despite the latest corrective bounce.
GBP/USD: Four-hour chart

Trend: Limited recovery expected