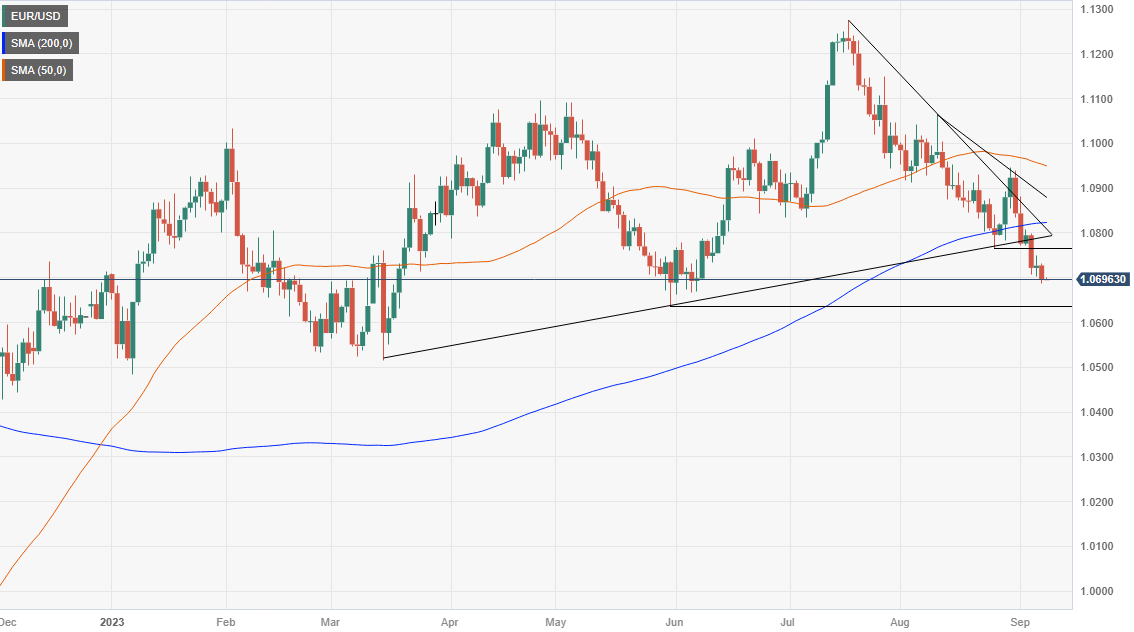
EUR/USD Price Analysis: Hovers below 1.0700, eyeing the 1.0600 figure amid bearish signals
- EUR/USD trades at 1.0696, up 0.01%, but remains below the pivotal 1.0700 mark, signaling potential for further downside.
- For a bullish reversal, the pair needs to clear 1.0700 and aim for September 6 daily high of 1.0748 as an intermediate resistance.
- Most likely scenario sees EUR/USD targeting May 31 low of 1.0635, with a breach potentially exposing the 1.0600 psychological level.
The EUR/USD begins the Asian session almost flat but below the 1.0700 figure, seen as a bearish signal, after printing losses of 0.29% on Thursday, which could open the door to test May lows. At the time of writing, the major trades at 1.0696, up 0.01%.
EUR/USD Price Analysis: Technical outlook
The daily chart portrays a continuation of the downtrend, as the pair achieved a new lower-low and trades near the bottom of the weekly range. However, being the 1.0700 figure that usually keeps the EUR/USD seesawing in the top/bottom of the double zero mark, buyers and sellers need to take action to win the battle.
For buyers, the EUR/USD must climb above 1.0700 and reclaim the September 6 daily high of 1.0748, an intermediate resistance level. Once cleared, the pair's next ceiling level would be the September 5 high at 1.0798 before challenging the 200-day Moving Average (DMA) at 1.0822.
On the flip side, and the most likely scenario, due to recent economic data and the EUR/USD breaking decisively below the 200-DMA, the first support would be the May 31 daily low of 1.0635. A breach of the latter will expose the psychological 1.0600 figure, followed by the March 15 swing low of 1.0516.
EUR/USD Price Action – Daily chart
