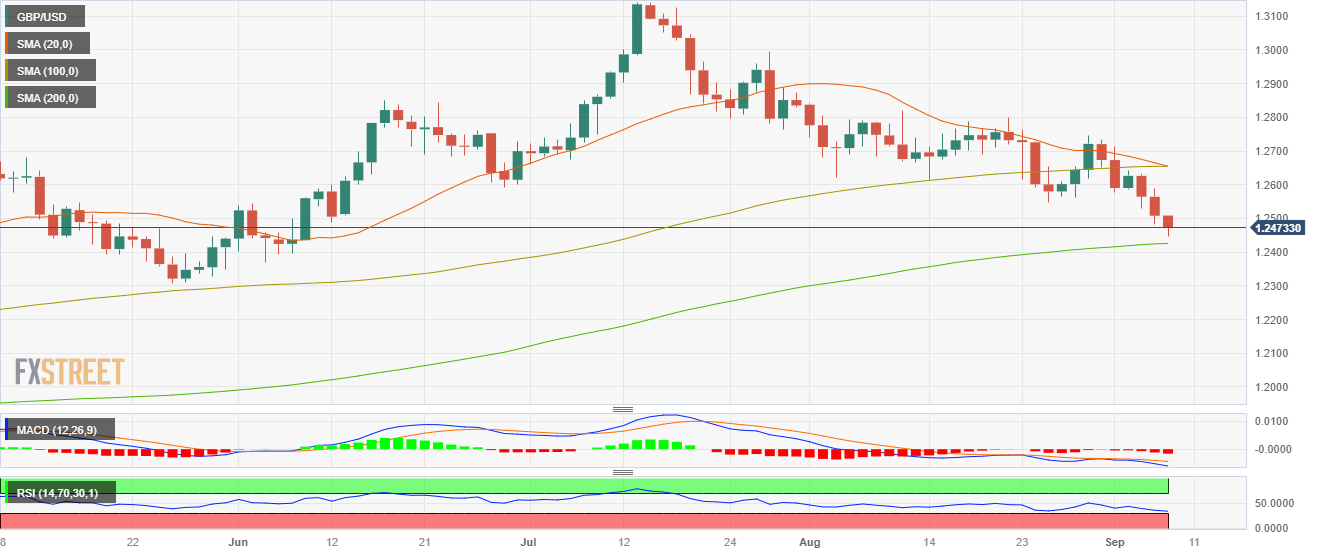
GBP/USD threatens the 200-day SMA amid dovish bets on the BoE
- GBP/USD declined for a third consecutive day towards the 1.2470 area.
- Initial Jobless Claims from the US from the first week of September come in lower than expected.
- Investors await next week's CPI figures from the US from August.
- Market’s bet on a less aggressive BoE after Monetary Policy hearings on Wednesday.
On Thursday, the GBP/USD turned south and seems to be heading to the 200-day Simple Moving Average (SMA) at 1.2420 for a restest. A resilient USD and falling British yields are responsible for the pair’s movements.
On the data front, Jobless Claims from the week ending on September 1 came in slightly lower at 216,000 vs. the 234,000 expected, decelerating from the previous weekly reading of 229,000. The initial reaction boosted the USD, and the DXY increased to nearly 105.10.
The US Treasury yields are retreating but remain high, suggesting investors are gearing up for another Federal Reserve (Fed) hike this cycle. The 2-year consolidated Wednesday’s upward movements and declined below 5%, while the 5 and 10-year yields stand at 4.38% and 4.26%. Regarding expectations, economic activity in the US remains robust and doesn’t show signs of cooling, which would give the Fed the green light to consider one last hike. In that sense, the CME FedWatch tool suggests that the odds of one more 25 basis point (bps) hike stand near 40%, keeping the USD afloat.
On the GBP’s side, the 2,5 and 10-year rates are seeing more than 1% declines and may reflect that investors foresee a less aggressive Bank of England (BoE). On Wednesday, Andrew Bailey commented that the bank would remain data-dependent and didn’t commit to further hikes. At the same time, Swati Dhingra pointed out that the policy is “sufficiently restrictive”.
GBP/USD Levels to watch
The technical analysis of the daily chart points to a neutral to bearish outlook for GBP/USD, indicating the potential for further bearish movement. The Relative Strength Index (RSI) is getting nearer to oversold conditions, while the Moving Average Convergence (MACD) histogram presents rising red bars. Moreover, the pair is below the 20 and 100-day Simple Moving Averages (SMAs), but above the 200-day SMA, suggesting that despite the recent bearish sentiment, the bulls are still resilient, holding some momentum.
Support levels: 1.2420 (20-day SMA), 1.2400, 1.2380.
Resistance levels: 1.2470, 1.2500, 1.2550.
GBP/USD Daily Chart
