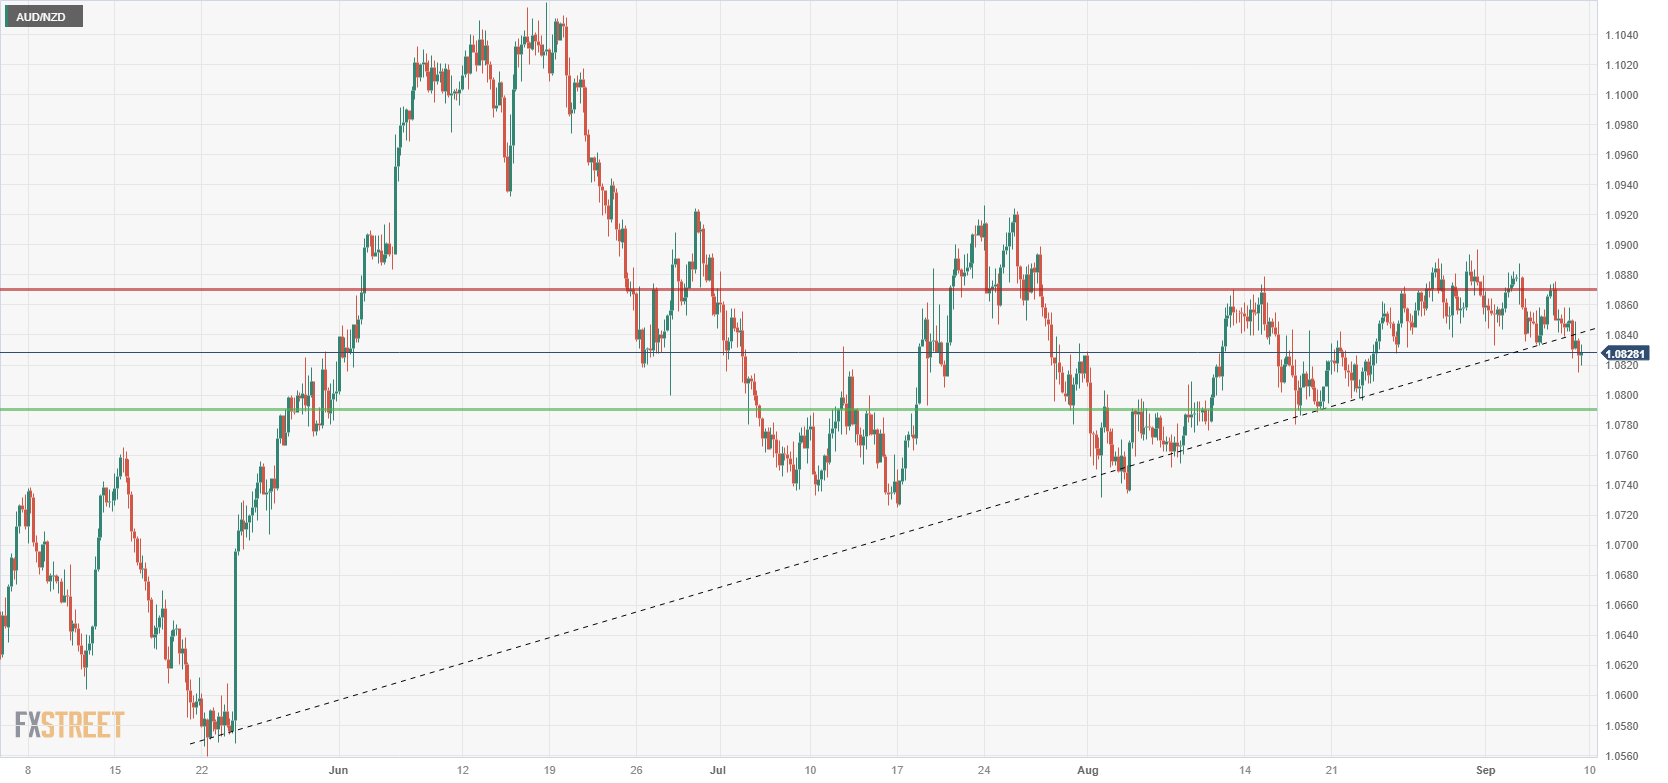
AUD/NZD dipping to two-week lows near 1.0830, weekend China CPI data looming
- The AUD/NZD is sagging, breaking down below the two-week range.
- The AUD has lost the coin toss against the NZD as traders position ahead of China inflation figures.
- With data dropping over the weekend, Monday promises further action.
The AUD/NZD pair is trading into two-week lows as the Aussie (AUD) waffles against its close neighbor, the Kiwi (NZD). With both currencies exposed to data impacts from China, investors have pegged the AUD as the bigger loser between the two.
China Consumer Price Index (CPI) numbers for China will be dropping during the market off-hours over the weekend, and markets could be positioning in advance, sending the Aussie out of the recent consolidation range in anticipation.
China CPI heading down the ramp
China inflation figures are expected to show a minor uptick to 0.2% YoY versus the previous contraction of -0.3%. Failure to achieve price growth for the Chinese economy would be a continued sign of economic weakness for the Asia region, and further selling pressure could send the AUD even lower for next week.
China data schedule; times in GMT

AUD/NZD Technical outlook
The Aussie-Kiwi pair has stepped into a two-week low, knocking on 1.0820 heading into the end of the week. With the cross trapped in a consolidation range between 1.0740 to 1.0940 for the past few months, breakout was all but inevitable, and 1.0760 to 1.0740 will be the support range in the near term.
On the bullish side, a break upwards on improving market sentiment will see the AUD/NZD challenging heavy resistance from 1.0880 before being able to move further on from there.
AUD/NZD 4-hour chart

Technical levels