GBP/JPY Price Analysis: Holds steady amid hawkish BoJ; sellers eye 183.00
- Strong Chinese data and hawkish comments by BoJ Governor Ueda underpinned the JPY.
- The pair is neutral to upward biased from a daily chart, at the brisk of breaching the Ichimoku cloud.
- Short term, the GBP/JPY is downward biased, set to test the 183.00 area.
The Pound Sterling (GBP) stops its decline vs. the Japanese Yen (JPY) as Tuesday’s Asian session begins, following Monday’s session that witnessed a 0.47% loss for the cross-currency pair. The reasons behind the move were good Chinese data and some hawkish comments by the Bank of Japan (BoJ) Governor Kazuo Ueda. The GBP/JPY is trading at 183.38, a gain 0.06%.
GBP/JPY Price Analysis: Technical outlook
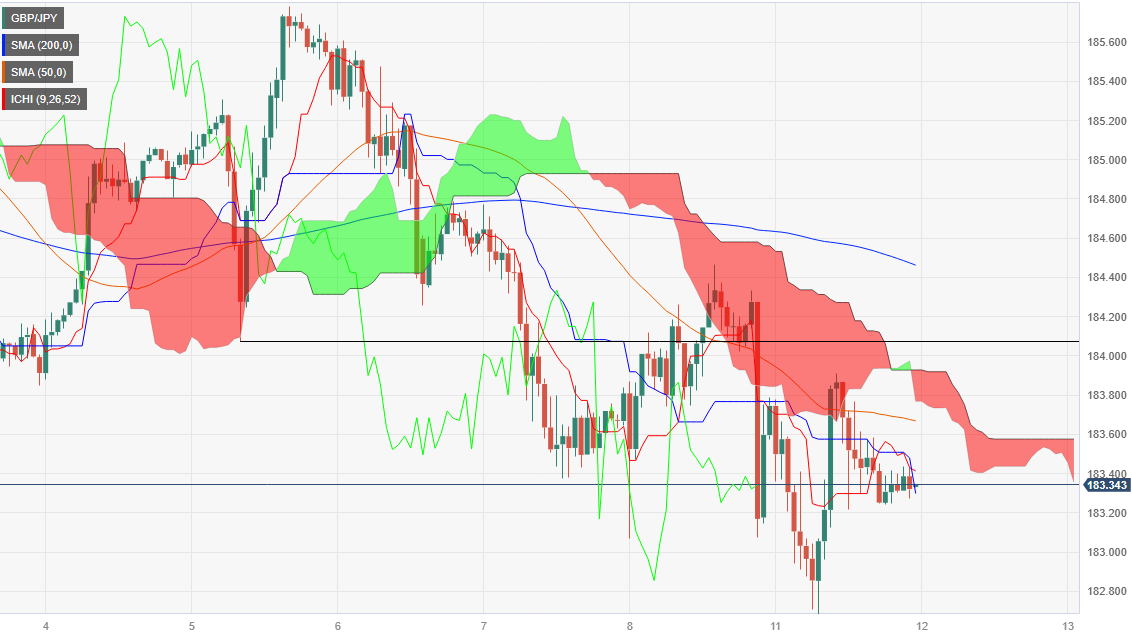
From a daily chart perspective, the pair is neutral to upward biased, remaining above the Ichimoku Cloud (Kumo). Nevertheless, since the cross printed the yearly high, the GBP/JPY achieved successive series of lower highs and lows, keeping that neutral stance on the cross. Also, an upslope support trendline, drawn from March 2023 lows, passes around 183.00. That said, a decisive break below the latter could open the door for further downside.
Short term, the GBP/JPY is set to extend its losses, capped on the upside by the Senkou Span B at 183.57. Once cleared, the pair’s next stop would be the bottom of the Ichimoku Cloud (Kumo) at around the 183.70 area, followed by a challenge of the 184.00 figure. Conversely, and the path of least resistance, the first support would be the 183.20 area. Once cleared, the cross would dive towards the 183.00 figure, followed by the September 11 daily low at 182.67.
GBP/JPY Price Action – Hourly chart
