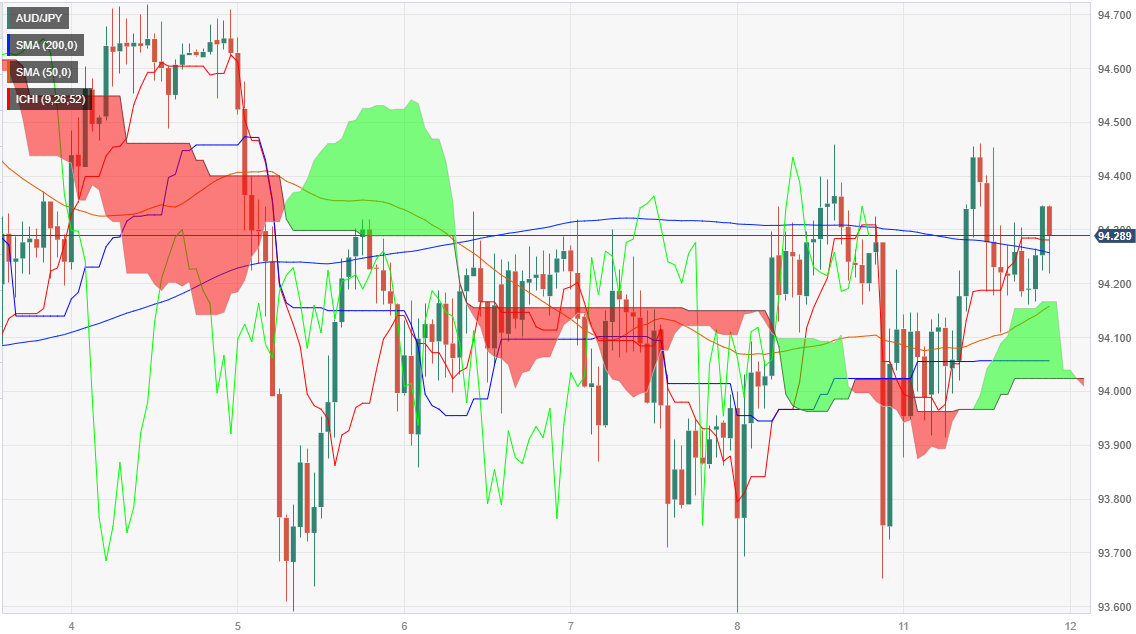
AUD/JPY Price Analysis: Subdued around current levels amid mixed signals from BoJ
- AUD/JPY trades at 94.22, almost flat as Tuesday's session begins.
- BoJ Governor Kazuo Ueda hints at the end of negative interest rates, sparking short-lived gains in JPY.
- Technical indicators suggest a neutral bias, with both buyers and sellers awaiting a fresh catalyst.
The Australian Dollar (AUD) posted minuscule gains on Monday versus the Japanese Yen (JPY), after the Bank of Japan (BoJ) Governor Kazuo Ueda made comments that the end of negative interest rates is possible if data warrants it. Hence, market participants priced in a possible monetary policy normalization as the JPY registered solid gains. Nevertheless, they were short-lived, as shown by the AUD/JPY pair. At the time of writing, the cross trades at 94.22, almost flat, as Tuesday’s session begins.
AUD/JPY Price Analysis: Technical outlook
The daily chart portrays the pair as neutral biased, with no clear bias, as the pair forms a symmetrical triangle preceded by a downtrend. Also, the Senkou Span A and B lines that form the Ichimoku Clous (Kumo) and the Tenkan and Kijun-Sen are flat. That said, neither buyers nor sellers are in charge, awaiting a fresh catalyst that directs the AUD/JPY pair.
From an hourly chart perspective, the pair finished Monday’s session near the session’s highs, suggesting an upward bias. Hence, the AUD/JPY first resistance would be the September 11 high at 94.45, followed by the September 4 swing high at 94.70, before challenging 95.00. Conversely, the first support would be the top of the Kumo at 94.10, followed by the 94.00 figure. A breach of that area would shift the bias downwards.
AUD/JPY Price Action – Hourly chart
