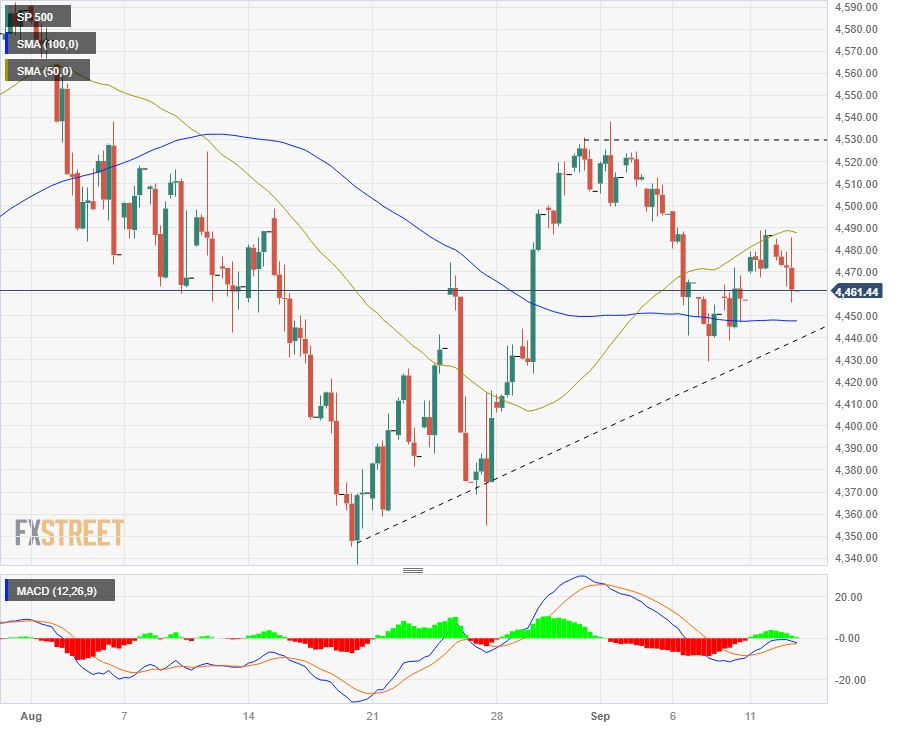
S&P 500 sags into $4,460.00 after Apple fails to inspire tech component
- S&P 500 takes a step down on flagging technology sector components.
- Equities on softer footing ahead of key US CPI data due on Wednesday.
- Despite declines, S&P tech component up nearly 40% for 2023.
The Standard & Poor’s (S&P) 500 equity index is seeing red for Tuesday, slipping to the $4,460.00 area after opening the day neat $4,480.00.
Apple Inc’s highly-anticipated marketing event on Tuesday couldn’t provide support for the S&P 500 as Apple shares slumped nearly 2% following the announcement of the next version of their flagship iPhone line as the announcement failed to inspire investors.
Techs down on Tuesday despite stellar performance for the year
The technology sector component of the S&P 500 is broadly lower for Tuesday, down 1.5% for the day. Despite this, the technology facet of the major index is still up more than 37% for 2023.
S&P 500 technical outlook
The S&P spent most of Tuesday in the green, but couldn’t hold onto the gains heading into the close and finished the trading day slightly down.
The large-cap index is currently hung in the middle of a bullish inversion of the 100- and 50-period Simple Moving Averages (SMAs), with the 100-period SMA providing near-term support from $4,450.00 while a rising trendline from August’s lows near $4,350.00 represents rising support to fend off any bearish pushes.
Immediate resistance rests at the peak of September’s early highs near $4,530.00 but remains capped by the overshot 50-period SMA parked near $4,490.00.
S&P 500 4-hour chart

S&P 500 technical levels