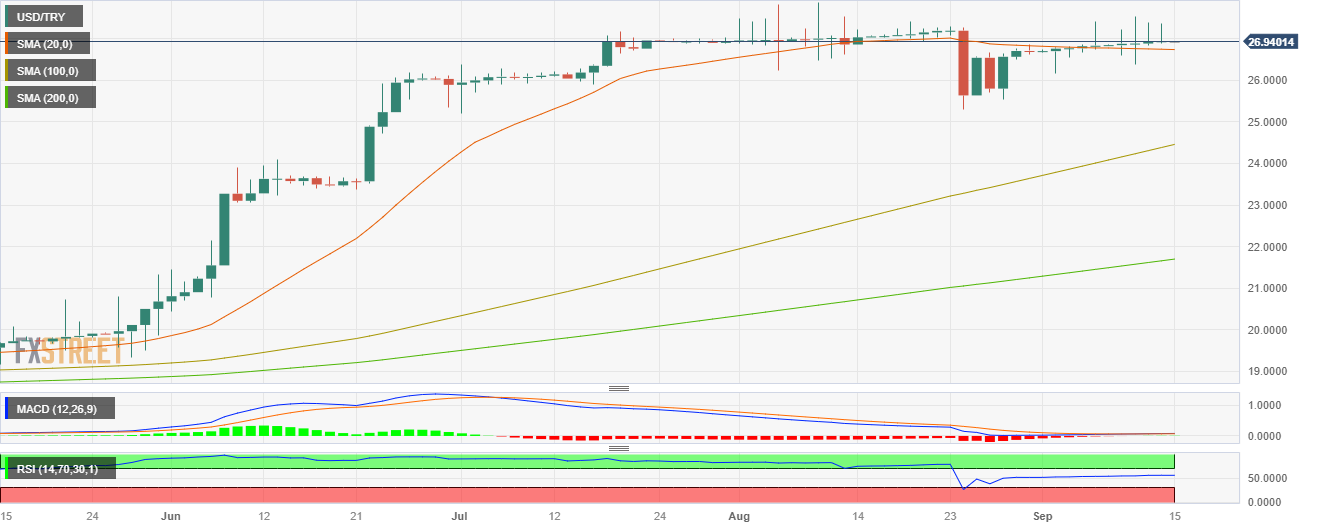
USD/TRY flirts with 27.00 as the USD strengthens
- The USD/TRY has advanced slightly in the last two weeks and traded neutral at 26.95.
- The USD holds strong amid solid economic figures reported by the US.
- CBRT is expected to raise rates to 30%.
The USD/TRY continued to side-ways trade on Thursday but flirts with the 27.00 resistance. On the one hand, the US reported strong economic figures, while the expectations of more tightening by the Central Bank of the Republic of Türkiye (CBRT) support the TRY.
The US economy seems to be the last man standing. The Producer Price Index (PPI) surged by 0.7% MoM, reaching 1.6% YoY in August, surpassing expectations. Retail Sales showed strong growth, up by 0.6% MoM, exceeding the anticipated 0.2% rise. Jobless Claims in the second week of September rose to 220,000, slightly above the previous week's 217,000 but below the expected 225,000.
Nevertheless, the CME FedWatch tool indicates a reduced likelihood of the Federal Reserve (Fed) implementing a 25 basis point (bps) interest rate hike for the remainder of 2023, with the odds slightly declining to 35%. Still, the Fed will receive plenty of data until the next November and December meetings, and those data points will ultimately justify whether the bank should hike or not. In the meantime, the USD enjoys higher demand as its economy remains resilient, and investors hope for a soft landing.
On the other hand, according to a Standard Chartered Global Research report, the Central Bank of the Republic of Türkiye (CBRT) is expected to raise its one-week repo rate by 500 basis points to 30% on September 21, following a 750 basis points hike in August and recent hawkish communication from policymakers. In addition, rising inflationary pressure on the back of higher fuel prices and additional fiscal imbalances justifies more tightening.
USD/TRY Levels to watch
Upon evaluating the daily chart, a neutral to bullish outlook for the short term is seen, with the bulls gradually recovering their strength. The Relative Strength Index (RSI) shows a flat slope in the positive territory, while the Moving Average Convergence (MACD) exhibits flat green bars. Moreover, the pair is above the 100- and 200-day Simple Moving Averages (SMA), suggesting that the bulls are firmly in control of the bigger picture.
Support levels: 27.00, 27.15, 27.30
Resistance levels: 26.80 (20-day SMA), 26.50, 26.15.
USD/TRY Daily chart
