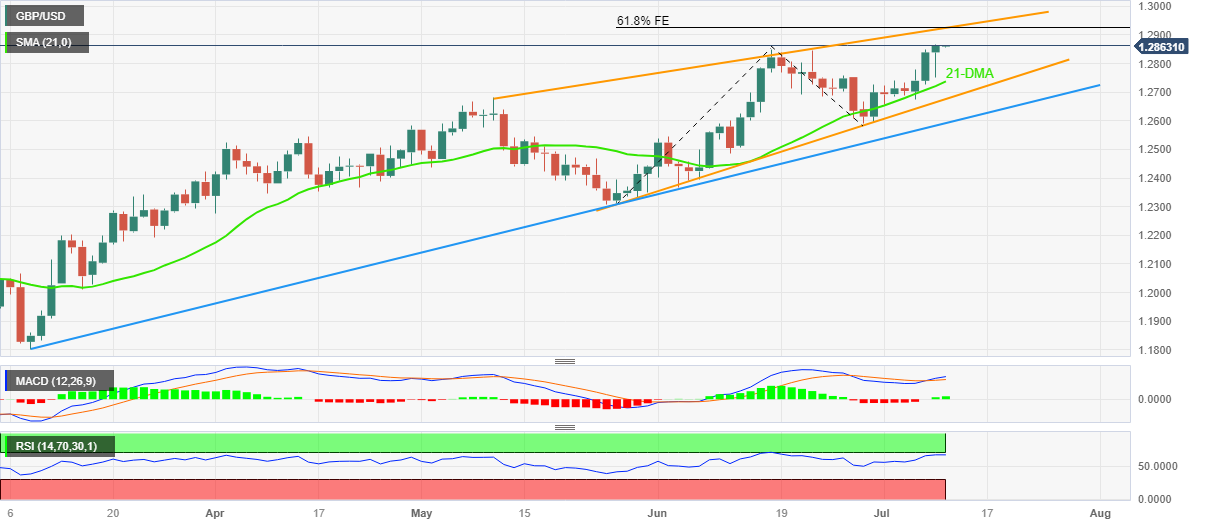
GBP/USD Price Analysis: Overbought RSI prods Cable bulls at multi-day top near 1.2860 ahead of UK employment
- GBP/USD grinds near the highest level since April 2022, marked the previous day.
- Clear upside break of 1.2850 hurdle, bullish MACD signals favor Cable buyers.
- Overbought RSI conditions test Pound Sterling’s upside momentum within two-month-old rising wedge.
- Convergence of 61.8% FE, wedge’s top line appear a tough nut to crack for bulls.
GBP/USD bulls take a breather at the highest levels since April 2022, making rounds to 1.2860-65 amid the early hours of Tuesday’s Asian session. In doing so, the Cable traders await the latest round of UK employment data to confirm the recent hawkish comments from Bank of England (BoE) Governor Andrew Bailey.
Also read: GBP/USD hits YTD high amid USD weakness, cautiously eyes 1.3000 amid BoE speculations
Apart from the BoE Governor Bailey’s speech, the Pound Sterling’s ability to cross the 1.2850 hurdle, comprising multiple tops marked since late June, also keeps the GBP/USD pair buyers hopeful ahead of the key UK jobs report. Adding strength to the upside bias are the bullish MACD signals.
However, the overbought RSI (14) line checks the bulls within a two-month-old rising wedge bearish chart formation.
With this, the Cable pair is likely to witness a pullback towards the 1.2850 resistance-turned-support before recalling the sellers. Though, the quote’s further downside appears difficult.
That said, the 21-DMA support of around 1.2740, the stated rising wedge’s bottom line near 1.2675 and a four-month-old upward-sloping trend line close to 1.2590 will act as additional downside filters before giving control to the GBP/USD bears.
On the flip side, a convergence of the aforementioned bearish chart pattern’s top line and 61.8% Fibonacci Extension (FE) of its late May to June 29 moves, near 1.2925, appears a tough nut to crack for the Cable buyers. Also challenging the GBP/USD buyers is the 1.3000 psychological magnet.
GBP/USD: Daily chart

Trend: Pullback expected