USD/CAD trades into the low end after back-and-forth Monday action, looking for 1.3450
- USD/CAD testing into the 1.3450 level after cycling on Monday.
- The US Dollar is broadly higher, but the CAD is catching a late-day bump in crude oil prices.
- Economic calendar is mostly devoid of CAD data, leaving things open for US GDP figures on Thursday.
The USD/CAD slipped a scant 0.2% for Monday, after tapping into a mild intraday high of 1.3491.
The pair has fallen about 1.7% from September's peak near 1.3694. Oil prices have been squeezing higher on market-wide supply constraint fears, which has been bolstering the commodity-based Loonie (CAD) despite the US Dollar's (USD) broad rise across the market.
There is little of note on the economic calendar for Canada this week, and focus will squarely be on USD data impact.
Thursday will see US Gross Domestic Product (GDP) figures, as well as a speech from Federal Reserve (Fed) Chair Jerome Powell. Annualized GDP for the second quarter is forecast to tick higher from 2.1% to 2.3%.
On Friday, we will see US Personal Consumption Expenditure (PCE) data, which is expected to hold steady for the month of August at 0.2%.
Canadian GDP numbers will also land on Friday, but market impact is likely to be muted as US data churns the charts.
Canadian GDP for the month of July is expected to print at a flat 0%, but still an improvement over the previous month's 0.2% decline.
USD/CAD technical outlook
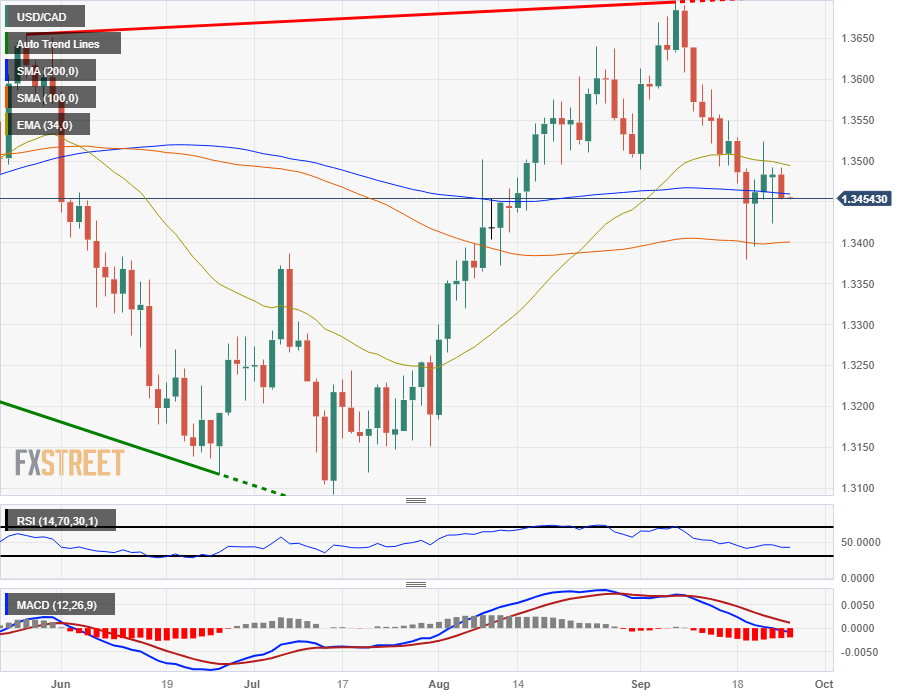
The USD/CAD saw a clean rejection of the 200-hour Simple Moving Average (SMA) in intraday trading, and is set for a challenge of a rising near-term trendline from last Wednesday's swing low near 1.3400.
On daily candlesticks, the USD/CAD is strung along the 200-say SMA. A bearish push from this region will see the pair lose the 1.3400 major handle, while a bullish rebound will need to reclaim the 1.3600 level before pushing to new highs.
USD/CAD daily chart

USD/CAD technical levels