Gold Price Forecast: XAU/USD struggling to hold on to $1,915
- Gold buyers are struggling to hang on to $1,915.00 for Monday.
- A well-bid US Dollar is seeing the XAU/USD flounder into recent lows.
- Analysts see Gold reaching $2,200 by the end of the year, but policy risks remain.
The XAU/USD took a step lower on Monday, knocking into $1,915.00 and seeing little relief pressure as the US Dollar (USD) catches bids across the board.
Spot gold prices have steadily drifted lower in 2023, peaking just below $2,080.00 back in early May. The XAU/USD is down almost 8% from the year's high, but still remains well-supported looking long-term, with Gold up nearly 20% from last October's lows of $1,650.00
Gold's long-standing relationship with US Treasury yields has softened in recent months; while the yellow metal has a tendency to closely track with US yields, that relationship has broken down for most of 2023. US yields have appreciated considerably, but Gold remains unable to capitalize on bond momentum.
$2,000 by end-2023, $2,200 by end-2024?
Despite downward price pressure, analysts are forecasting lofty end-of-year Gold spot valuations.
Commodity analysts from Société Générale (SocGen) see Gold capped under $2,000 to end the trading year, but 2024 is expected to see Gold prices improve to $2,200 by the end of 2024, on the back of easing inflation expectations and a slipping US Dollar Index.
XAU/USD technical outlook
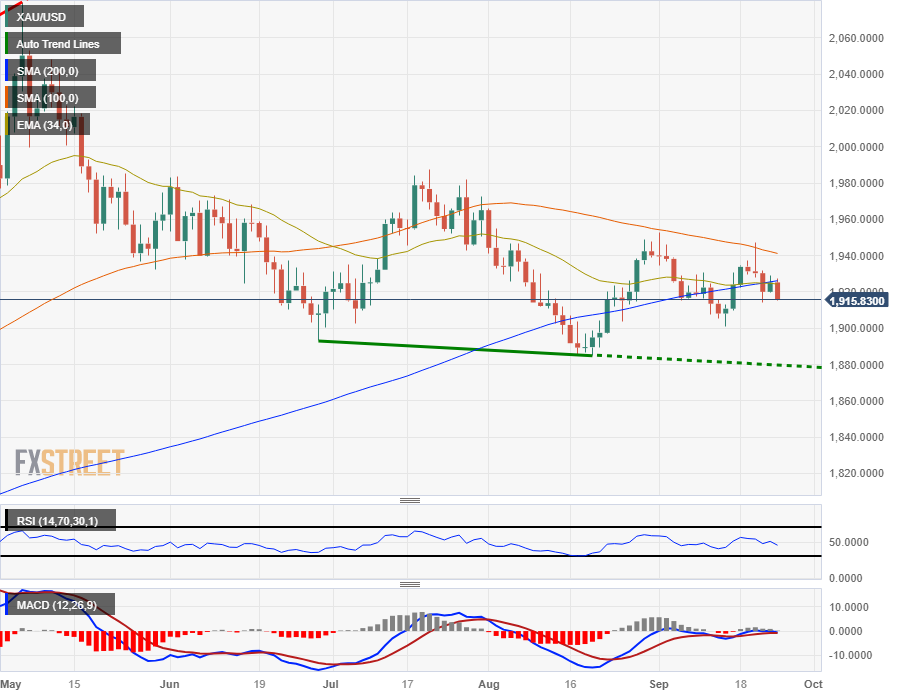
Hourly candles see Gold flubbing to last week's swing lows below $1,915.00, while the upside is set to be constrained by near-term resistance from the 100-hour Simple Moving Average (SMA) near $1,925.00.
On the daily candlesticks, the XAU/USD is seeing a notable lack of meaningful momentum, with Gold stuck near the 200-day SMA which is still moving bullish into $1,930.00.
Bidders will be looking to shove Gold back above $,1930.00 to continue a push higher, while sellers will be looking to take the XAU/USD down to August's lows below $1,890.00.
XAU/USD daily chart

XAU/USD technical levels