WTI faces headwinds as Russia lifts ban amid strong US Dollar on Fed’s hawkish hold
- WTI crude oil trades with over 0.50% losses after hitting a high of $90.34.
- Federal Reserve's decision to hold rates but project higher rates for the next year has snapped WTI’s three-week rally.
- Oil prices were cushioned by a drop in oil rigs count in the US, along with China’s economic recovery accelerating.
West Texas Intermediate (WTI), the US crude oil benchmark, traded with more than 0.50% losses on Monday as Russia tweaked its fuel ban. At the same time, higher interest rates in the United States (US) boosted the Greenback (USD), a headwind for US dollar-denominated assets. WTI is trading at $89.35 per barrel, late in the North American session.
West Texas Intermediate dips on Russia’s relaxing fuel ban, strong USD
Investors' mood remains downbeat as speculations the US central bank would increase rates one more time. According to some banks on Wall Street, Russia’s approval of changes to its fuel export ban was a headwind to oil prices, which were set to hit $100 per barrel.
Last week’s Fed decision to hold rates but upward revise the dot-plots for the next year, foreseeing rates above 5%, snapped oil’s three-week rally that witnessed WTI gaining more than 10%, as Saudi Arabia and Russia extended its crude oil output cuts toward December 2023.
The Fed sent US bond yields skyrocketing, underpinning the Greenback to a year-to-date high of 106.09, as drafted by the US Dollar Index (DXY). Nevertheless, WTI’s fall was cushioned by the oil rig's count falling last week to 507 from 515, despite higher oil prices.
In the meantime, speculations of better economic data from China keep oil traders’ spirits higher, following last week’s data. China is the world’s largest oil importer, and if economic activity slows down, it could weigh on global oil prices.
WTI Price Analysis: Technical outlook
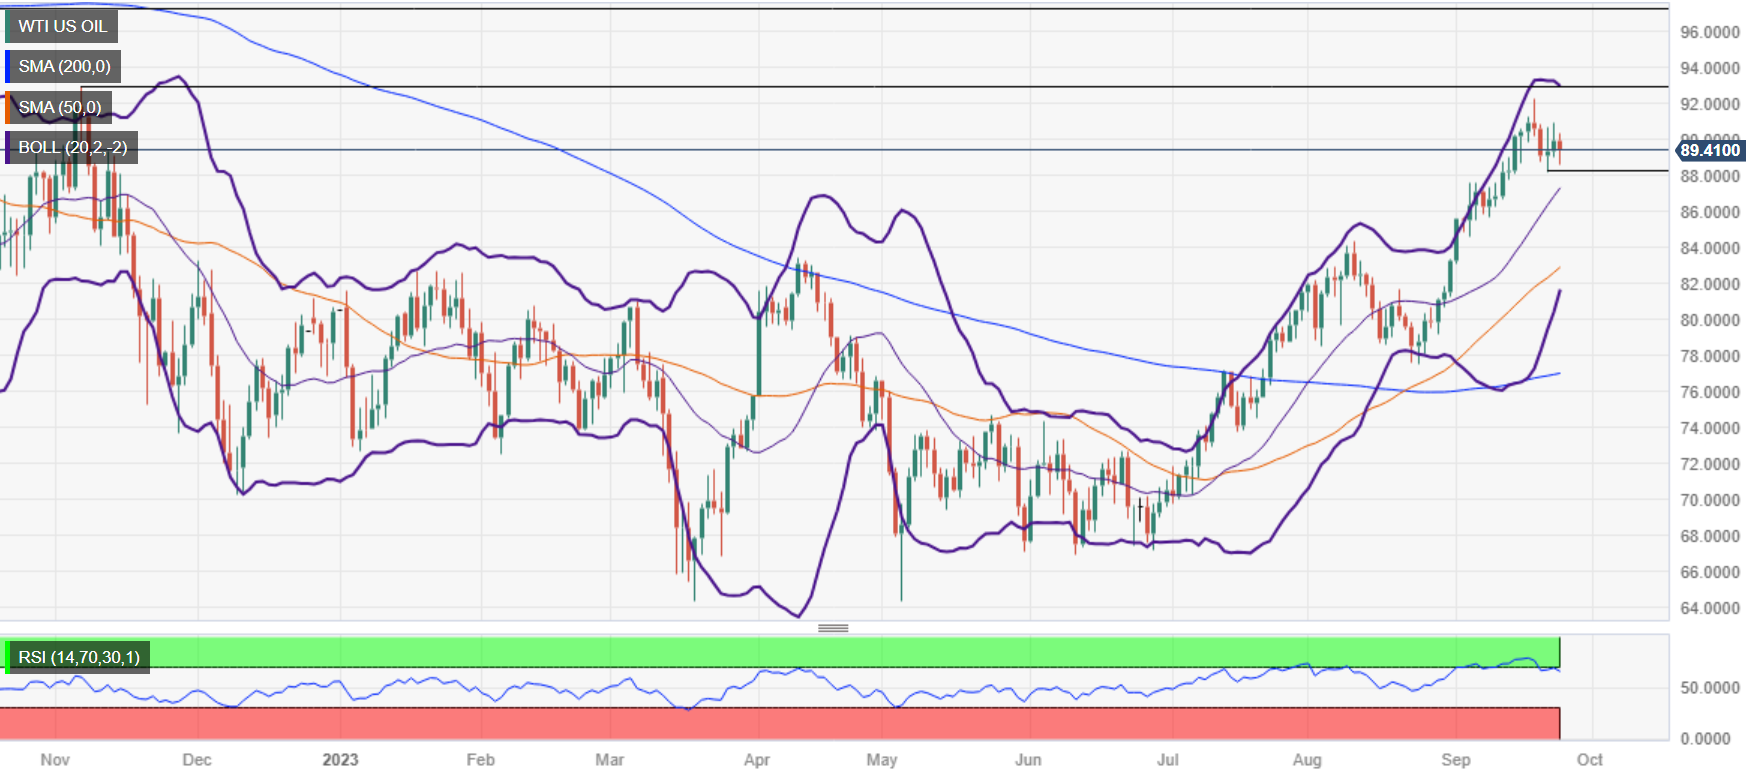
WTI remains upward biased but fails to pierce the top-Bollinger band, while the Relative Strength Index (RSI) exits from overbought conditions, opening the door for a pullback. Support is seen at the September 21 daily low of $88.15 before the US crude oil price tests the 20-day Exponential Moving Average (DMA) at $87.31. Contrarily, WTI would resume its uptrend but must clear last Friday's high at $90.93 before challenging the year-to-date (YTD) high at $92.26.
