European equities slide to fresh lows, FTSE closes down 60 points into £7,624
- European equities broadly moved lower on Monday, testing into new lows for the month.
- FTSE, CAC40 lose 60 points apiece, DAX tumbles 151 points.
- Rising yields, economic concerns weighing European equities down.
European stock indexes closed broadly lower for Monday, with the German DAX taking pride-of-place as the biggest loser for the day, shedding 151 points to end the day down just shy of a percent, near €15,405.00.
Exporters with notable exposure to Chinese markets slipped in Monday trading, with equities pressured by rising bond yields for the European Central Bank (ECB) on the back of interest rates that rose to 4% last week.
Equities looking weaker to keep Monday on the bearish side
Weakening metal prices also saw mining equities decline, with rising inventories hampering price growth for precious metals.
Monday overall is striking bearish notes across the board for equities after the Shanghai Composite and Hang Seng indexes closed in the red at -0.48% and -1.82% respectively. The FTSE shed 0.85% and the CAC40 declined 0.85%.
FTSE technical outlook
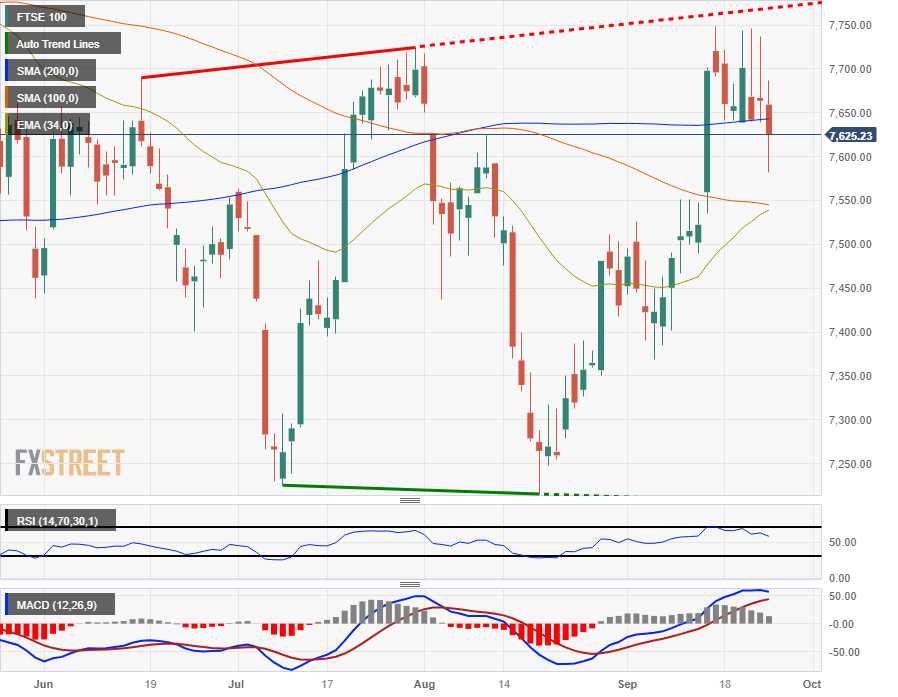
The FTSE is at risk of taking a bearish turn on daily candlesticks, with the UK's main equity index continuing to slip from near-term highs at the £7,750.00 level.
the 200-day Simple Moving Average is acting as a price magnet, keeping the index hamstrung near £7,650.00.
Swing highs are getting capped, and swing lows are routinely running into a floor pricing in near £7,250.00.
Near-term traders will want to keep an eye out for a run-in with the 34-day Exponential Moving Average (EMA), currently lifting into £7,550.00.
FTSE daily chart

FTSE technical levels