Silver Price Analysis: XAG/USD pillorying continues, Silver extends decline over 11%
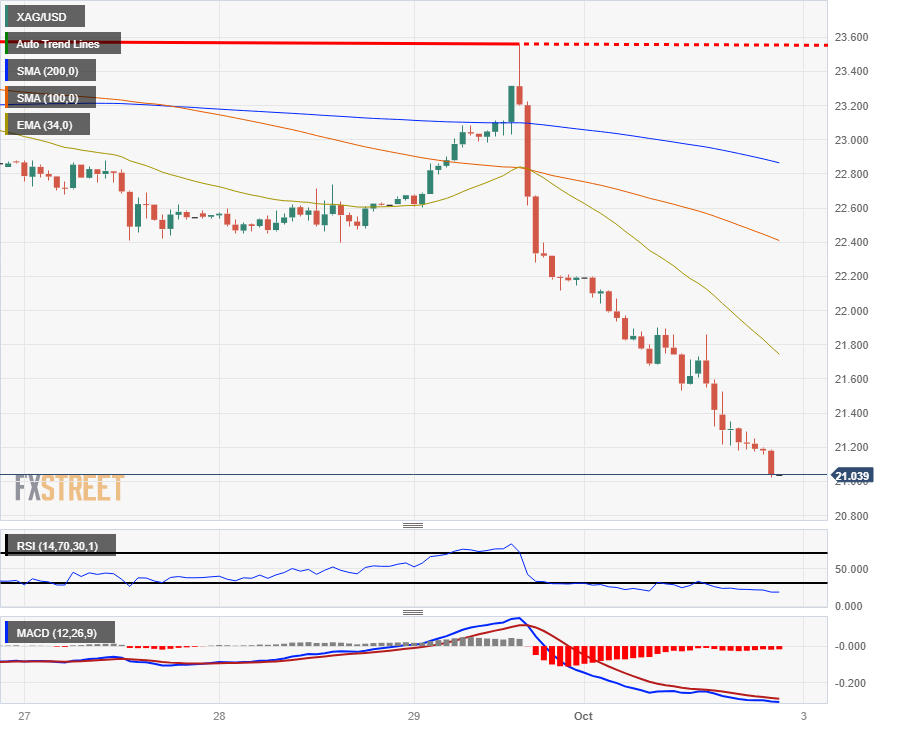
- XAG/USD continues its downside tumble on Monday, shedding value and slumping back into $21.00.
- Silver prices peaked at $23.56 last Friday before stumbling as broad-market risk appetite sours.
- Rising US Treasury yields coupled with a climbing US Dollar sees Silver getting knocked lower.
The XAG/USD continues to sag, crashing into the $21.00 handle as Monday see Silver prices extend declines kicked off in Friday's broad-market sell-off as investors clamor into the US Dollar in a safe haven bid.
Climbing US Treasury yields are putting pressure on Silver as investors churn on rising expectations of a global recession, coupled with market jitters stemming from the US government's recent budget standoff, where government officials brought the US to the eleventh hour on funding agreements and threatened to spark the fourth US government shutdown in a decade.
The US was able to secure itself a last-minute funding deal, but the temporary measure is set to run out of time once again in mid-November, where budget brinkmanship is expected to again rile global markets.
Forex Today: US Dollar shows its strength, RBA to keep rates unchanged
XAG/USD technical outlook
Hourly candles show Silver essentially in freefall in the near-term, with the XAG/USD down over 11% from Friday's peak at $23.56, and intraday action has pulled the bids far away from the 200-hour Simple Moving Average (SMA) currently turning bearish into $22.80.
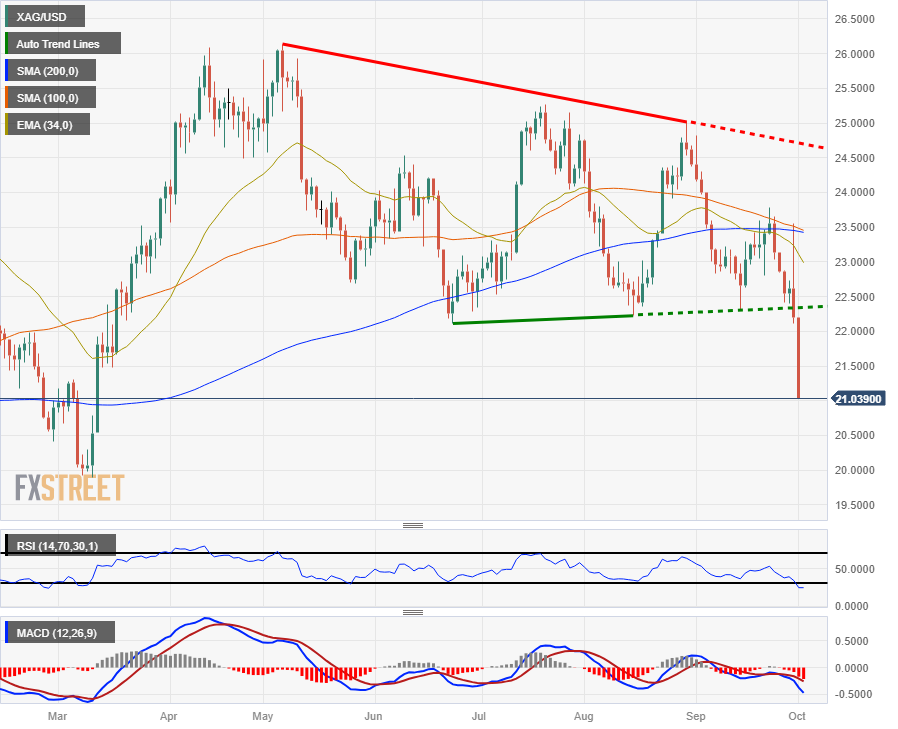
Daily candlesticks are not fairing much better, with the XAG/USD failing to catch any meaningful bullish momentum from the bottom of the previous consolidation range, and dropping further into new seven-month lows.
Silver is now down over 12% for 2023, and further bearish momentum will see the XAG/USD even further underwater and set to claim new lows for 2023 below March's bottom near $19.90.
XAG/USD hourly chart

XAG/USD daily chart

XAG/USD technical levels