Gold Price Analysis: XAU/USD trying to hit the brakes, down into $1,824 for Tuesday
- Gold on pace to close in the red for the seventh consecutive day.
- XAU/USD has closed lower for ten of the last eleven daily trading sessions.
- Gold prices are down nearly 6.5% from the last swing high into $1,947.55.
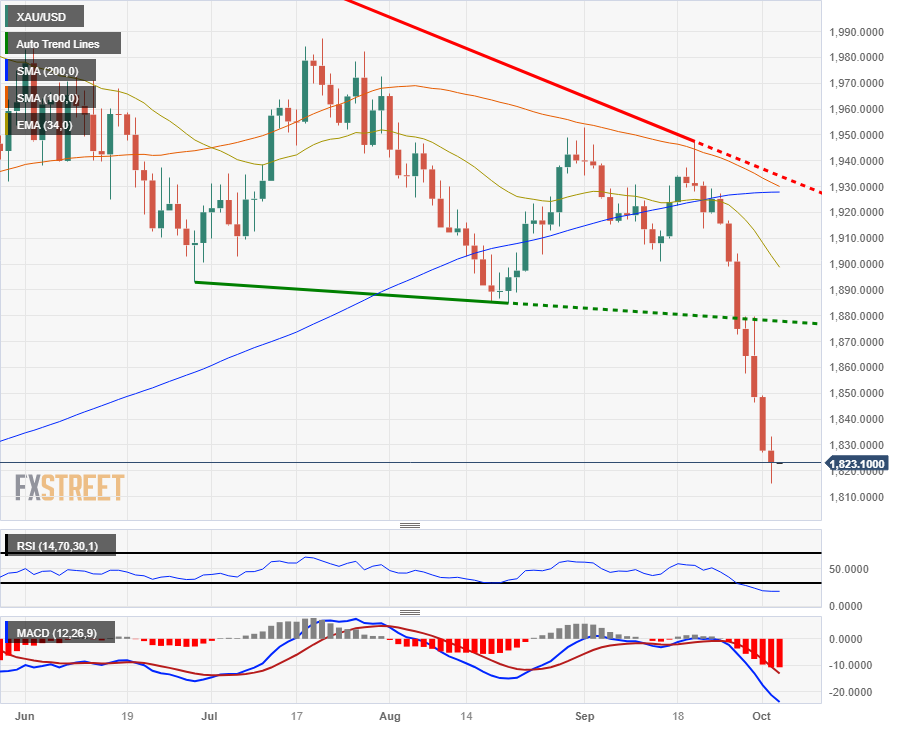
Gold prices are softly down on Tuesday as broader markets continue to radiate risk-off energy, trading into $1,823.30 as risk aversion remains the key theme for markets heading into the mid-week.
The XAU/USD is trading into seven-month lows, and a break lower south of $1,804.76 will see Gold trading into its lowest prices in nearly a year, and will set new lows for 2023.
Broad-market risk appetite has evaporated in recent days, sparked by rising concerns of the odds of a global recession, and investors have been flocking into the safe haven US Dollar (USD) as market headwinds continue to rise.
US Treasury yields have been climbing as the US government narrowly averted a shutdown on partisan brinkmanship, but the temporary stopgap measure only funds the US government through mid-November. Investors are unlikely to have much confidence stoked by the 45-day reprieve, and markets can expect to be forced back into another tension spiral by November 17th if the US can't square away a functioning budget.
Gold Futures: Further losses on the cards
Gold price struggles to capitalize on modest intraday recovery from multi-month low
XAU/USD technical outlook
Gold prices are down over 5% in under a week and a half, sliding from $1,926 and extending the precious metal's decline from 2023's peak near $2,075.
Daily candlesticks see the XAU/USD tumbling well away from technical indicators, with the 200-day Simple Moving Average (SMA) well above current price action near $1,930 and technical indicators breaking in oversold territory.
The Relative Strength Index (RSI) is at its lowest value of 19.58 since 2015, and a break into $1,800 will see Gold prices turn red for the year.
XAU/USD daily chart

XAU/USD technical levels