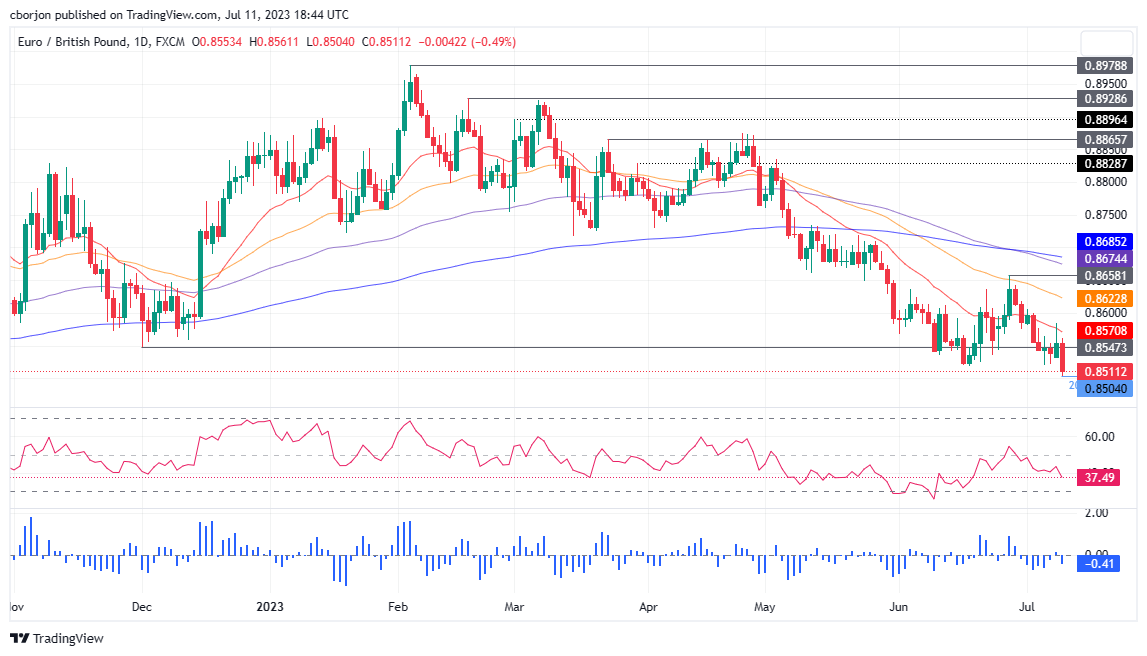
EUR/GBP Price Analysis: Slumps to YTD low as bearish engulfing chart pattern emerges
- UK employment data drive EUR/GBP lower, as BoE’s hike expectations increased.
- Following a bearish engulfing pattern, the pair could test the 0.8500 mark and below.
- Oscillators suggest seller momentum is increasing; further EUR/GBP downside is warranted.
The EUR/GBP slides to a fresh year-to-date (YTD) low of 0.8504 after a solid employment report in the United Kingdom (UK) increased the chances for a 50 basis point rate hike by the Bank of England (BoE) on August 3; hence, the EUR/GBP dropped sharply. At the time of writing, the EUR/GBP exchanges hands at 0.8511, down 0.44%.
EUR/GBP Price Analysis: Technical outlook
From a technical perspective, the EUR/GBP drop below the 20-day Exponential Moving Average (EMA) of 0.8592 on July 4 opened the door for a deeper fall. As of writing, the cross formed a bearish engulfing candle pattern after hitting a weekly high of 0.8584, suggesting that lower prices are expected near term.
If EUR/GBP achieves a daily close below the June 19 daily low of 0.8518, that could pave the way for a test of the 0.8500 mark. A breach of the latter would clear the path, with no intermediate support levels, toward the August 24 swing low of 0.8408, before sliding further down to the August 2 low of 0.8339.
Conversely, a daily close above 0.8518m could indicate a consolidation around the 0.8500-0.8580 area up next. A decisive break over the top of the range could expose 0.8600 and the 50-day EMA at 0.8623.
With both scenarios laid down, oscillators suggest that further downside is expected. The Relative Strength Index (RSI) is bearish and aiming toward oversold conditions, while the three-day Rate of Change (RoC) depicts sellers are gathering momentum. Therefore, the EUR/GBP path of least resistance is downwards.
EUR/GBP Price Action – Daily chart
