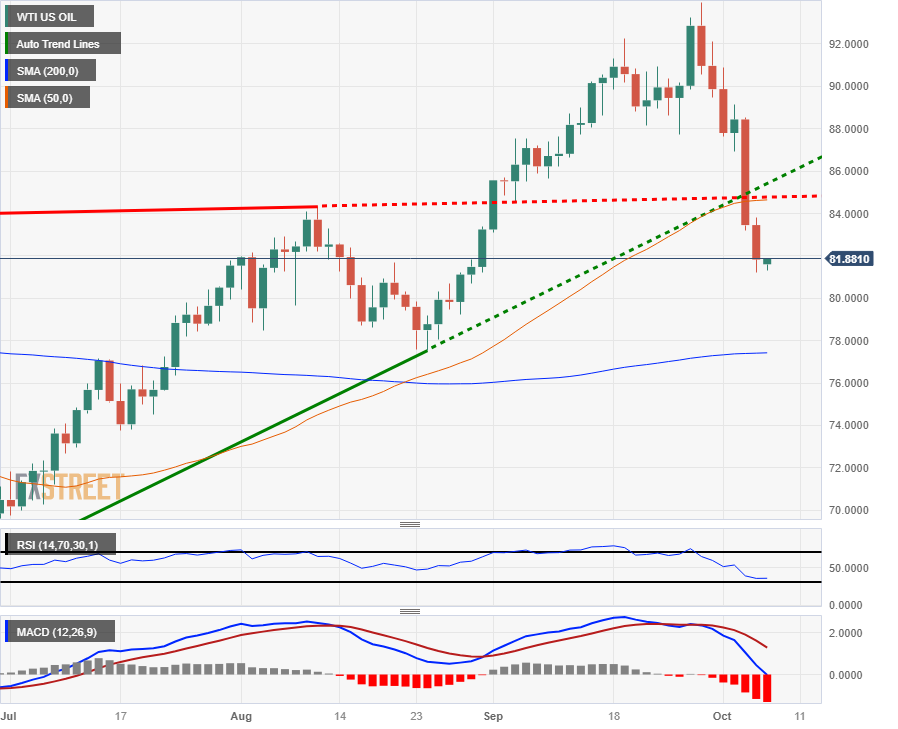
WTI Crude Oil prices extend decline, WTI barrels slide 2% on Thursday
- Crude Oil is continuing its recent decline as investors turn about-face to fret over global demand.
- Futures markets that initially anticipated oil prices over $100/barrel are reversing direction and liquidating positions.
- Global supply disruptions may turn out to be less severe than previous anticipated, despite reserve drawdowns.
West Texas Intermediary (WTI) Crude Oil barrel prices fell another 2% on Thursday, falling to a low $81.21 before recovering in the late hours of the trading day to bid into $81.88.
A crude oil pipeline originating in Iraq and running through Turkey is expected to resume operations soon, after construction delays saw the project delayed for over six months. The Iraqi pipeline will be delivering crude oil barrels to exporting hubs in order to ease lopsided supply markets.
Saudi Arabia and Russia helped spark a flight in barrel costs recently when they announced they would be extending production and exportation caps through the end of the year, but investors are now pivoting to fear a decline in global oil demand.
Thursday and Wednesday's combined two-day drop marks the largest two-day decline for WTI crude barrels since May.
Long positions established in Crude Oil futures markets that were previously anticipating WTI reaching $100/barrel into the end of the year are rapidly liquidating their positions, taking flight as global production looks set to ease off undersupply worries as crude-hungry economies across the globe look set to see waning Crude Oil demand, with the pivot out of fossils exacerbated by the recent crude price surge.
WTI technical outlook
WTI Crude Oil has extended a decline through the bottom side of a rising trendline from late June's last bottom near $67.15, and crude prices are set for an extended challenge of the 200-day Simple Moving Average (SMA) near $78.00 if declines continue through the upcoming market sessions.
Crude barrel costs have seen a scorching run up the charts, pinging into thirteen-month highs just shy of $94.00/bbl in September before getting knocked lower fiercely by broad-market sell-offs fueled by souring risk sentiment giving way to outright risk aversion as investors piled into the US Dollar.
A recovery for the WTI crude price will need to overcome the 100-day SMA currently providing technical resistance from $84.64.
WTI daily chart

WTI technical levels