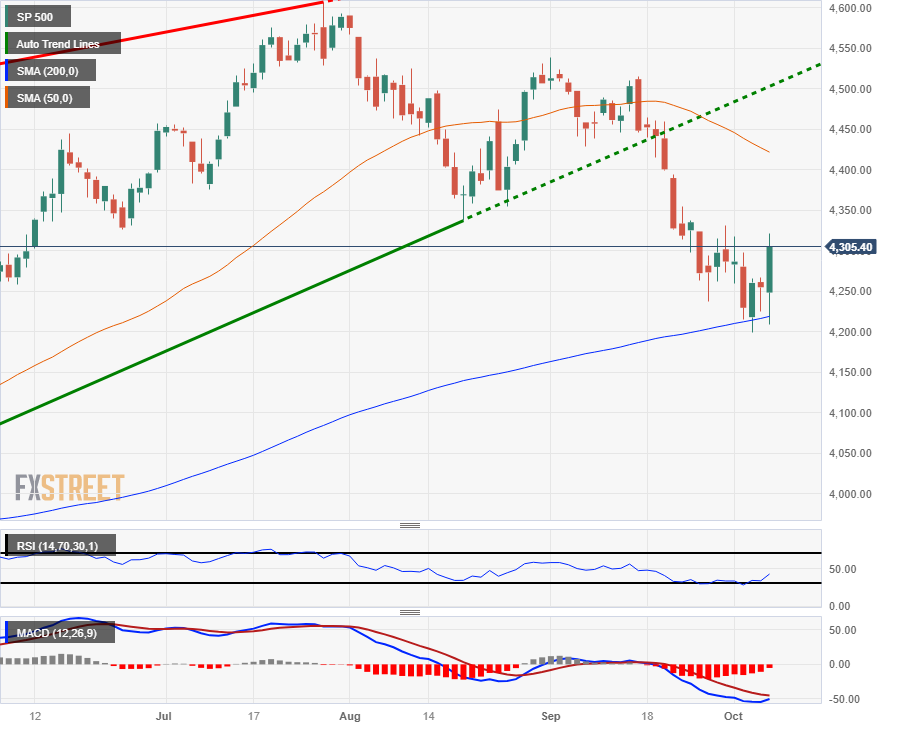
S&P 500 reclaims $4,300 after post-NFP market surge
- US equities caught a firm bid on Friday after a bumper NFP beat.
- The S&P 500 has pinged a new high for the week as investors pile out of safe havens to close out the trading week.
- Inflation data for the US will be the key focus moving forward as markets watch the Fed carefully.
The Standard & Poor's (S&P) 500 soared late Friday into $4,305 after markets yanked out the stopper and went full risk-on after US Non-Farm Payrolls handily beat the street, printing at a forecast-clobbering 336K against the anticipated 170K, and the previous figure was also revised higher to 227K from 187K.
US Nonfarm Payrolls soar by 336,000 in September vs. 170,000 forecast
US equities have been knocked lower as of late, crushed underfoot by rising US Treasury yields. Investors, fearing that still-high inflationary pressures will keep the Federal Reserve (Fed) stuck in a higher-for-longer rate cycle.
Next week sees US Producer Price Index (PPI) numbers and the latest draft of the Fed's meeting minutes, and investors will be turning an eye towards next week's Consumer Price Index (CPI) to re-focus on inflation pressures after Friday's focus shift.
US: All eyes will be on inflation data – RBC
S&P 500 technical outlook
The S&P 500 closed out the trading week at $4,305 after tapping a new weekly high of $4,321.94. The major US equity index fell to an intraday low of $4,208.68 on reaction to the bumper NFP reading, before market sentiment shifted into high gear and giving the S&P a much-needed rebound into a new high for the week.
On the daily candlesticks the S&P 500 is in desperate need of a bullish extension after seeing a bullish rejection from the 200-day Simple Moving Average (SMA) near $4,220, but the index still remains firmly bearish, still down 6.5% from July's peak of $4,607, and is still stuck below technical resistance from the 50-day SMA at $4,421.78.
S&P 500 daily chart

S&P 500 technical levels