EUR/JPY Price Analysis: Remains subdued, capped by a bearish-harami candle pattern
- EUR/JPY hovers at 157.66, seeking direction amidst a prevailing consolidation phase.
- Upside capped by Ichimoku Cloud; a breach of 158.26 needed to target September highs.
- Bearish signals from Chikou Span and Tenkan-Kijun cross may direct focus towards 156.40/49.
EUR/JPY traded sideways for the second straight day, though it printed gains of 0.52% on Tuesday and closed at 157.70. As Wednesday’s Asian Pacific session begins, the cross-currency pair is trading at 157.66, registering minuscule losses of 0.02%, at the time of writing.
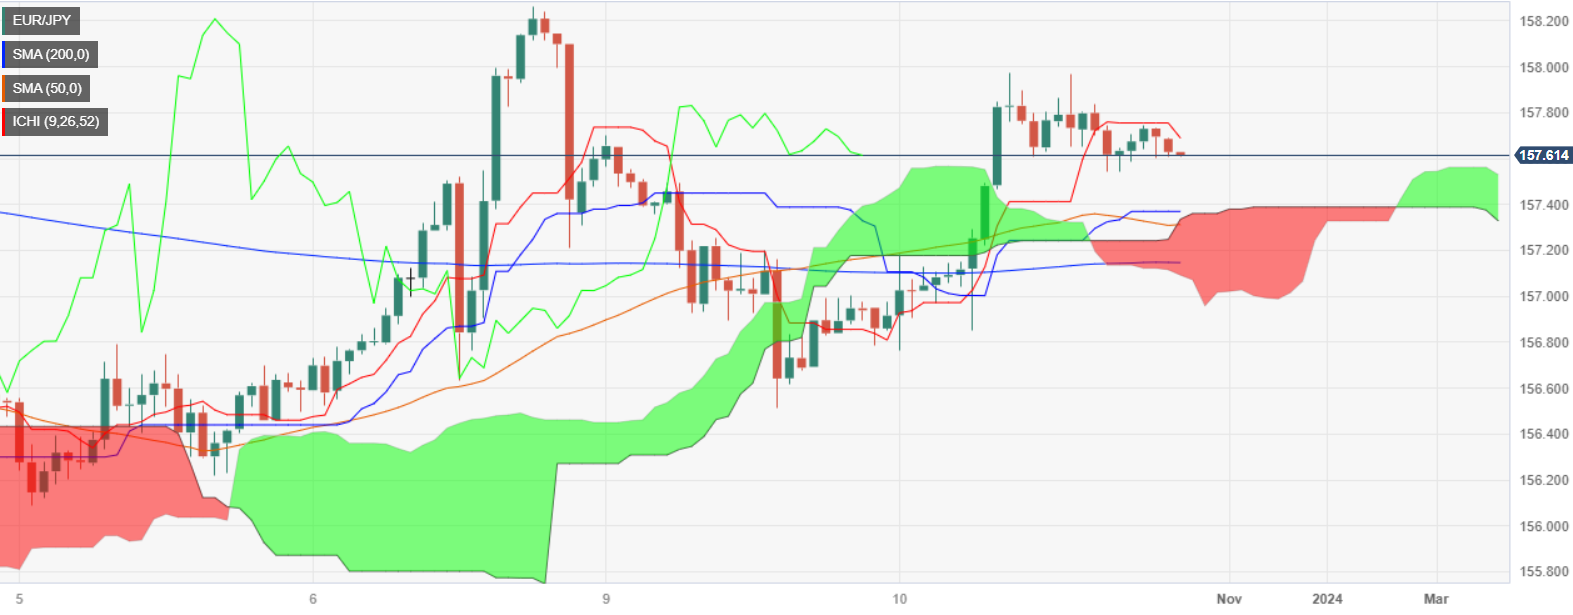
Although the daily chart shows the pair remains in consolidation, it remains tilted to the downside as it has failed to record higher highs, since October 6 at 158.26. A breach of the latter is needed, which would put into play, the next cycle high printed on September 13 daily high at 158.65.
Consequently, the EUR/JPY is capped on the upside by the top of the Ichimoku Cloud (Kumo), which if broken could pave the way for further upside. Nevertheless, price action is tracking the top of the Kumo, and with market sentiment being fragile and the Chikou Span crossing below price action, a bearish signal, the pair could test the bottom of the Kumo at 155.50/60. Additionally, the Tenkan-Sen crossing below the Kijun-Sen could act as a magnet, and price action aims towards the 156.40/49 area.
EUR/JPY Price Action – Daily chart

EUR/JPY Technical Levels