AUD/USD holds losses after cautious FOMC minutes
- AUD/USD dropped to 0.6405, already tallying more than 0.50% losses on the day.
- FOMC minutes from the September meeting didn’t reveal any surprise.
- Members are set to proceed “carefully” in the next meetings.
In Wednesday’s session, the AUD/USD is seeing more than 0.50% losses, mainly weighted by the US Dollar recovering some ground after the Federal Open Market Committee (FOMC) minutes from the September meetings. On the Aussie's side, no relevant highlights were seen on the Australian economic calendar.
In line with that, the minutes revealed that the members are considering the lags of monetary policy and the latest data volatility in their decisions, noting that they will still proceed carefully regarding their next decisions. In summary, the bank doesn’t rule out an additional hike in 2023.
As decisions will be made on the incoming data, the September US Consumer Price Index (CPI) figures will be closely watched on Thursday. Headline CPI is seen declining to 4.1% YoY, while the Core measure is expected to decelerate to 3.6% YoY. Jobless Claims from the first week of October are also due in Thursday’s session and are expected to have increased to 211,000 from 207,000.
AUD/USD Levels to watch
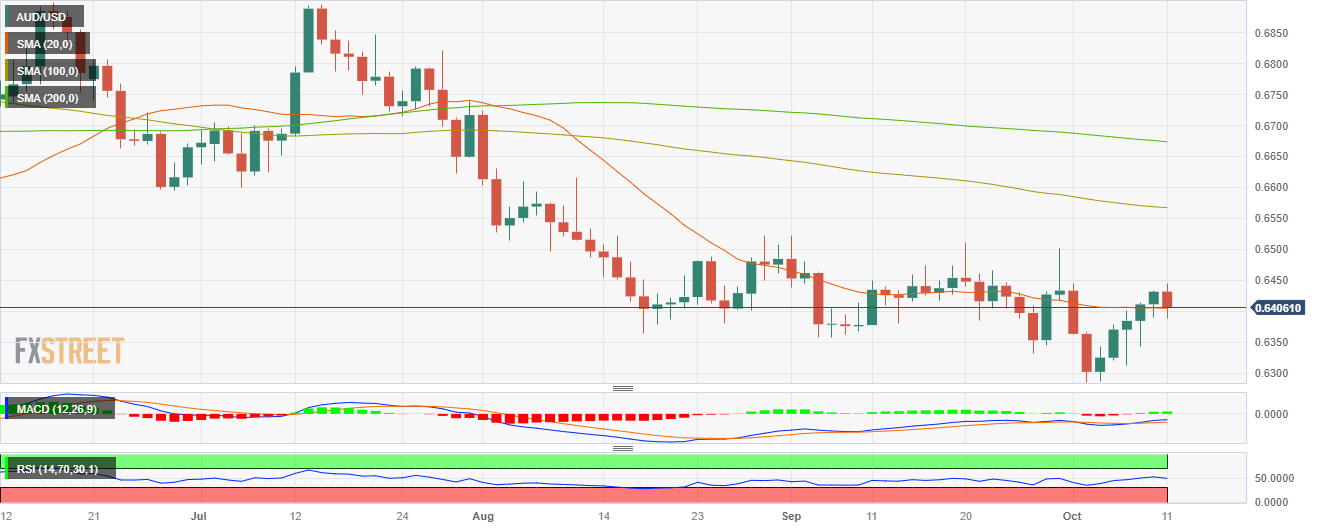
Considering the daily chart, AUD/USD presents a neutral to bearish technical outlook, with the bulls displaying signs of fatigue. The Relative Strength Index (RSI) displays a negative slope in the bullish territory, hinting at a potential shift in momentum, while the Moving Average Convergence (MACD) presents neutral green bars. Also, the pair is below the 20-day Simple Moving Average (SMA) but above the 100 and 200-day SMAs, pointing towards the prevailing strength of the bulls in the larger context.
Support levels: 0.6405 (20-day SMA),0.6370, 0.6350.
Resistance levels: 0.6450, 0.6500, 0.6530.
AUD/USD Daily Chart

AUD/USD
Overview
Today last price0.6405
Today Daily Change-0.0027
Today Daily Change %-0.42
Today daily open0.6432
Trends
Daily SMA200.6405
Daily SMA500.6438
Daily SMA1000.6569
Daily SMA2000.6676
Levels
Previous Daily High0.6433
Previous Daily Low0.639
Previous Weekly High0.6445
Previous Weekly Low0.6286
Previous Monthly High0.6522
Previous Monthly Low0.6332
Daily Fibonacci 38.2%0.6417
Daily Fibonacci 61.8%0.6407
Daily Pivot Point S10.6404
Daily Pivot Point S20.6376
Daily Pivot Point S30.6361
Daily Pivot Point R10.6446
Daily Pivot Point R20.6461
Daily Pivot Point R30.6489