USD/CHF Price Analysis: Lingers below the 200-DMA as sellers target 0.8900
- USD/CHF experiences a retreat, trading at 0.9014, marking a 0.76% decline, after failing to sustain a surge above the 0.9088 level.
- A double top formation and a subsequent V-shape drop signal potential downside, with the 0.8986 weekly low in sight.
- Key support looms at the psychological 0.9000 level, followed by the 50-DMA at 0.8938.
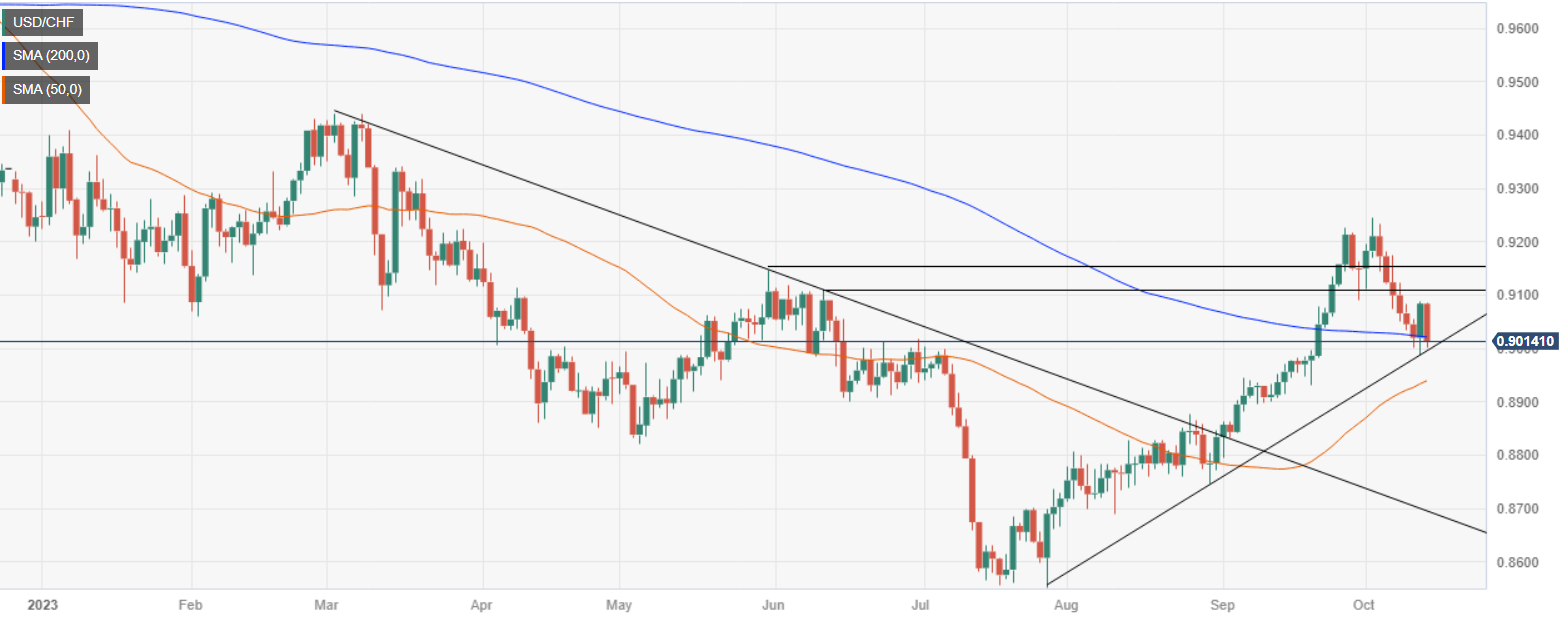
The USD/CHF retreats after climbing more than 0.70% on Thursday and oscillates below the 200-day moving average (DMA) as sellers outpaced buyers, as the pair failed to get acceptance above today’s daily high of 0.9088. At the time of writing, the USD/CHF is trading at 0.9014, down 0.76%.
After forming a double top, the USD/CHF dipped toward its current week low of 0.8986, before bouncing off to the 0.9080s region, but buyers' failure to extend its losses triggered a V-shape drop in the pair. If the USD/CHF slides below 0.9000, the current weekly low of 0.8986 would be exposed, followed by the 50-DMA at 0.8938.
Conversely, if USD/CHF buyers hold the exchange rate above the 200-DMA, sitting at 0.9019, that could open the door to test weekly highs of 0.9088, followed by the psychological 0.9100 figure. Once cleared, the next stop would be the October 3 cycle high of 0.9245.
USD/CHF Price Action – Daily chart

USD/CHF Technical Levels