NZD/USD waffles on Friday, dips into 0.5890
- The NZD/USD caught a ride lower as the Kiwi gives up more chart paper to the Greenback.
- New Zealand's Business NZ PMI worsened early Friday, hobbling the NZD.
- Kiwi traders will be looking ahead to Monday's NZ CPI figures.
The NZD/USD is seeing soft downside heading into the trading week's close, sending the pair firmly into red territory for the week.
Early Friday's Business NZ Purchasing Manager's Index (PMI) showed a further decline in the confidence metric, down to 45.3 against the previous print of 46.1.
Kiwi traders will now have their eyes turned to New Zealand Consumer Price Index (CPI) inflation figures, due late Monday at 21:45 GMT.
NZ CPI inflation is forecast to twist, with the quarter-on-quarter figure forecast to step up from 1.1% to 2%, while the annualized figure into the third quarter is expected to tick downwards slightly from a flat 6% to 5.9%.
The Reserve Bank of New Zealand (RBNZ) is currently stuck in a wait-and-see holding pattern on interest rates, and both investors and the RBNZ will be keeping a close eye on inflation.
NZD/USD Technical Outlook
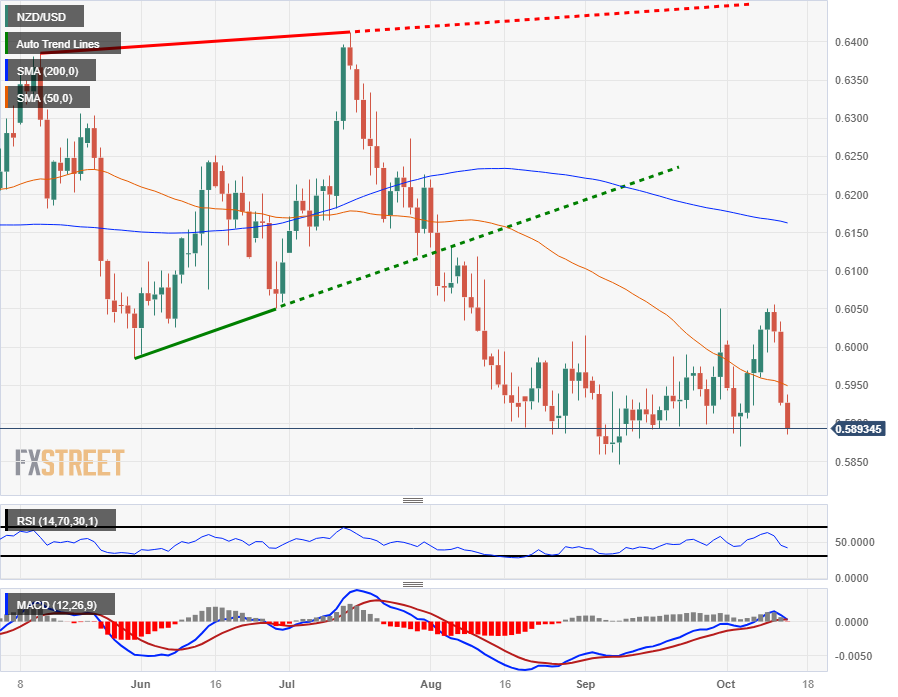
The Kiwi is firmly lower against the US Dollar on the intraday charts, and the NZD/USD is down 2.75% fro the week's highs at 0.6055.
The pair slid straight through the 200-hour Simple Moving Average (SMA) in Thursday's broad-market move into the US Dollar, and the Kiwi failed to establish a meaningful reversal on the charts, rising to a meager high of 0.5936 in Friday trading before slumping back into the basement and tapping a near-term low of 0.5886.
Daily candlesticks have the NZD/USD trading back into the low end of medium-term consolidation, and the Kiwi is plagued by a major bottom at the year's lows near 0.5850. Price action is currently getting hung up on the 50-day SMA as momentum bleeds out of the daily charts, and a bearish 200-day SMA is turning lower into 0.6150.
NZD/USD Daily Chart

NZD/USD Technical Levels