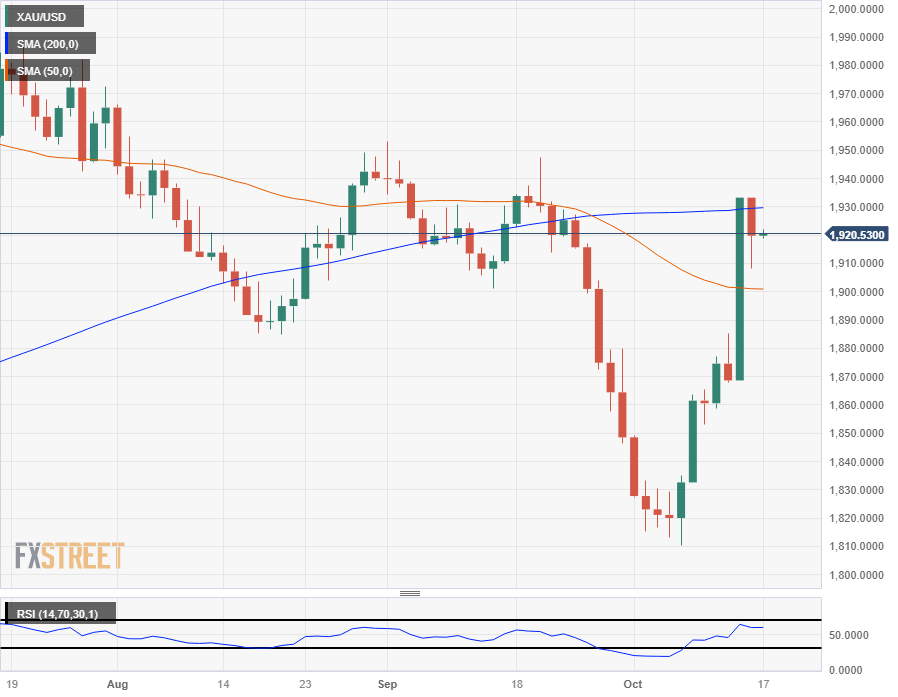
Gold Price Forecast: Thin Monday rebound leaves XAU/USD into $1,920
- Spot Gold took an early dip in Monday trading, testing into $1,908 before recovering alongside the rest of the market.
- Investor sentiment has broadly returned to risk-on after last week's souring.
- XAU/USD has flattened out heading into a hectic Tuesday trading session.
Spot Gold prices took an early tumble from the week's opening bids, sliding from Monday's $1,933, declining into $,1908 in early Monday trading before XAU/USD recovered investor sentiment alongside the broader market.
Last week saw investor risk appetite get snarled on the escalation of the Israel-Hamas conflict the weekend before last. Geopolitical concerns weighed on market sentiment all last week, but investors have appeared to shrug off the conflict and have eyes turned upwards.
Gold is set for a continuation of last week's gains. Friday saw an extended run for spot prices, with the XAU/USD gaining nearly 3.5% bottom-to-top.
XAU/USD Technical Outlook
Gold prices are getting hung up in the midrange on daily candlesticks, with the XAU/USD facing a rejection from the 200-day Simple Moving Average (SMA) near $1,930. The 50-day SMA is marking in a floor beneath prices, providing technical support from the $1,900 major handle, and price action is caught between the two moving averages.
XAU/USD's bullish reversal from early October's bottoms into $1,810 leaves spot Gold hung up in familiar territory, after Gold initially fell into the region after July's drop from the $1,980 neighborhood.
XAU/USD Daily Chart

XAU/USD Technical Levels