S&P 500 declines 1.34% on Wednesday as Treasury yields grind higher
- US equities see red for the mid-week as risk sentiment sours on Wednesday.
- Risk appetite is slumping as US Treasury yields rock into highs not seen in over a decade and a half.
- Middle East geopolitical concerns and a frozen US Congress are souring risk appetite.
The Standard & Poor's (S&P) 500 major equity index tumbled 58.60 points on Wednesday, closing down 1.34% to finish the day at $4,314.60 after broad-market risk appetite soured through the trading day, with investors pushed back into safe havens as the Gaza conflict escalation and a logjammed US Congress weigh on sentiment.
Geopolitical tensions around the Israel-Hamas conflict in the Gaza Strip continue to pin into the high end following a hospital explosion that claimed 500 civilians and left Israel and Hamas pointing the finger at the other over who was responsible for the deadly attack.
Wednesday's risk-off flows saw US equities fall across the board, with the Dow Jones Industrial Average (DJIA) falling 0.98% to close down 332.57 points at $33,665.08. The NASDAQ Composite saw deep red for Wednesday as tech stocks took the hardest hit of the day, with the tech index down 1.62% into $13,314.30, declining 219.44 points.
US Treasury yields rose with the 10-year T-note climbing above 4.9%, tipping into 4.928%, the 10-year's highest yield since early 2007.
Rate cost hikes are seeing spillover into other sectors with the popular US 30-year fixed mortgage median rate hitting 8% for the first time since 2000, a 23-year high.
Earnings season on Wall Street is seeing some grey clouds in an otherwise sunny profit reporting season, with 78% of earnings reports beating expectations.
Wednesday's biggest reporting losers include United Airlines which slid nearly 10% and Morgan Stanely which fell nearly 7% in its single worst trading day since 2020.
Headline earnings reporters for the rest of the day will be Netflix and Tesla, both of which report after the closing bell.
The US is facing political jitters as the US Congress remains frozen as US politicians struggle to elect a new Speaker of the House after previous Speaker Kevin McCarthy was ejected from the position by his own political party. Two failed votes in as many days leaves Congress hamstrung and unable to perform governance duties, and investors have one eye turned to the temporary funding stopgap that was delivered in the eleventh hour of the last funding standoff that froze Congress just a few weeks ago.
The temporary government funding measure is set to expire in only four weeks.
S&P Technical Outlook
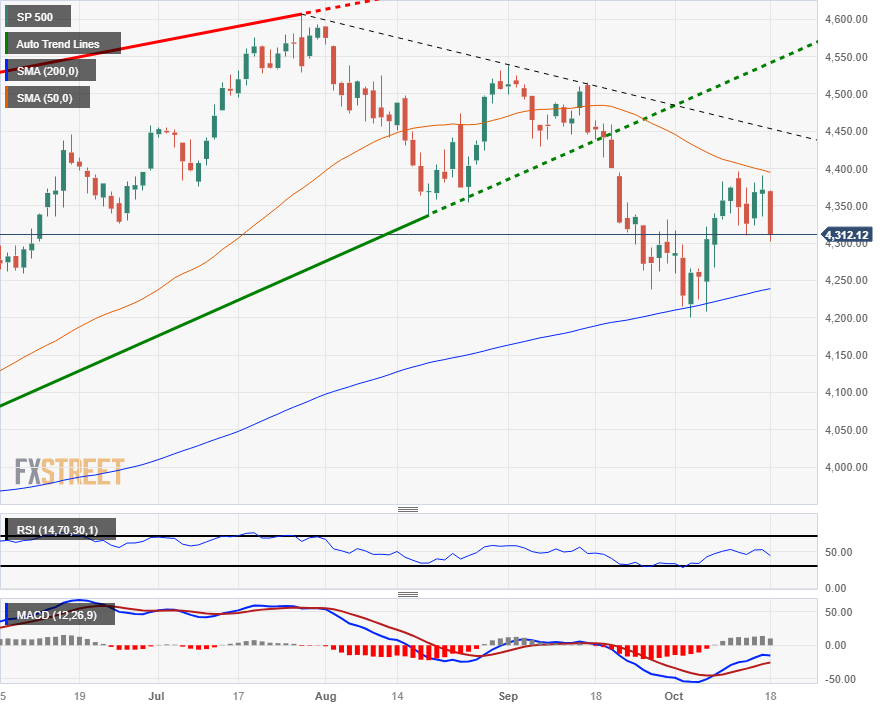
The S&P's failed jumpstart into the 50-day Simple Moving Average (SMA) has the equity index set to face the $4,300 major handle just below current price action, and an extended decline will see the S&P taking a run at the 200-day SMA just past the $4,250 key level, which the index last rebounded from in early October.
on the top side, a descending trendline from July's peak of $4,607 is firming up, with lower highs firming up a short-side trend pattern in the medium-term.
S&P Daily Chart

S&P Technical Levels