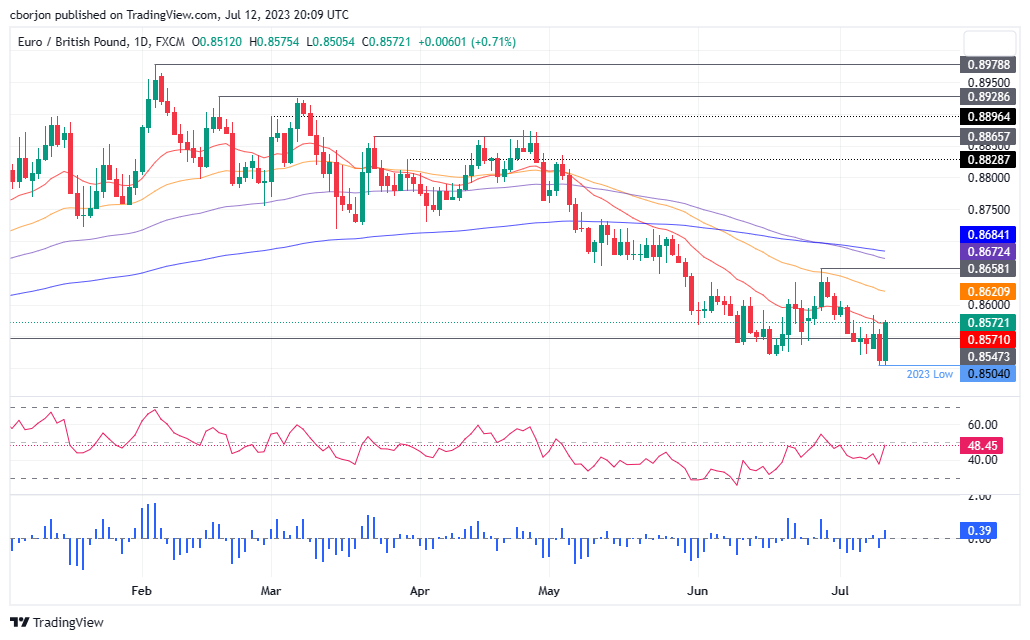
EUR/GBP Price Analysis: rebounds from YTD low, as a bullish-engulfing pattern looms
- EUR/GBP sees a significant bounce from YTD lows, climbing 70 pips and gaining 0.72%, spurred by rising EUR/USD.
- A bullish engulfing candlestick pattern indicates the possibility of further upside for the EUR/GBP pair, targeting 0.8600.
- Technical indicators, including the RSI and three-day RoC, show buyers gathering momentum, suggesting near-term bullishness.
EUR/GBP jumps from year-to-date (YTD) lows of 0.8504, climbs 70 pips, and gains 0.72% on Wednesday, underpinned by the rise of the EUR/USD pair. The EUR/GBP is exchanging hands at 0.8571 after hitting a daily low of 0.8505.
EUR/GBP Price Analysis: Technical outlook
After diving to a new YTD low of 0.8504, the EUR/GBP has risen sharply toward the 20-day Exponential Moving Average (EMA) at 0.8571. During the last couple of days, EUR/GBP’s price action formed a bullish engulfing candlestick pattern, suggesting further upside is expected; nevertheless, a daily close above the latter is needed to keep bulls’ hopes alive.
The EUR/GBP first supply zone to test would be the 0.8600 mark. Once cleared, the next stop will be the 50-day EMA at 0.8621, followed by the June 28 swing high at 0.8658. A breach of the latter will shift the cross-pair bias to neutral and expose key resistance levels. The next resistance will be the 200-day EMA at 0.8684, ahead of testing at 0.8700.
Notably, the Relative Strength Index (RSI) is about to turn bullish, while the three-day Rate of Change (RoC) depicts buyers gathering momentum. That said, the EUR/GBP is upward in the near term.
EUR/GBP Price Action – Daily chart
