Silver Price Analysis: XAG/USD surges past $24.00 as US inflation slumps
- Silver price leaps toward $24.00, gaining over 4% as US inflation decelerates, indicating a softer stance from the Fed.
- Technical outlook shows the XAG/USD uptrend could gather strength with a break above $24.20.
- Should XAG/USD fail to hold above $24.00, potential losses with critical support levels are highlighted in the $23-$23.50 range.
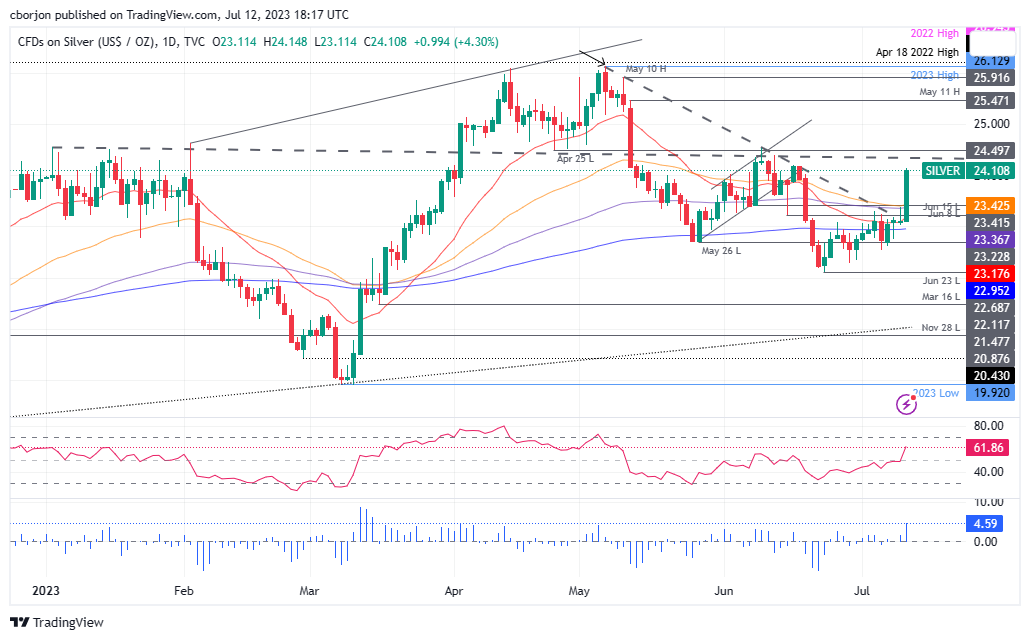
Silver price surged toward the $24.00 region on Wednesday following the release of the US Consumer Price Index (CPI), which showed inflationary pressures tumbling, suggesting the Federal Reserve (Fed) would not need to tighten as aggressively expected. The XAG/USD is trading at $24.07, gaining more than 4%, after hitting a low of $23.11.
XAG/USD Price Analysis: Technical outlook
The XAG/USD shifted from a neutral-downward biased to upward as price action broke technical resistance levels, with buyers eyeing a downslope resistance trendline, previously broken, which remains in play at around $24.30/45. If XAG/USD surpasses the latter, April’s 29 daily low at $24.49 would be up for grabs before XAG/USD threatens $25.00 per troy ounce.
Conversely, XAG/USD’s failure to achieve a daily close above $24.00 will expose the non-yielding metal to further losses. First, support will emerge at the 50-day EMA at $23.43, the 100-day EMA at $23.36, and then the 20-day EMA at $23.17. Once those levels are cleared, the 200-day EMA is up next at $22.95.
The Relative Strength Index (RSI) at bullish territory, the same as the three-day Rate of Change (RoC), suggests XAG buyers remain in charge. The XAG/USD uptrend is in play but look for breaks above $24.20 to gather further strength.
XAG/USD Price Action – Daily chart
