USD/NOK reversed its course from multi-month highs, clearing daily gains
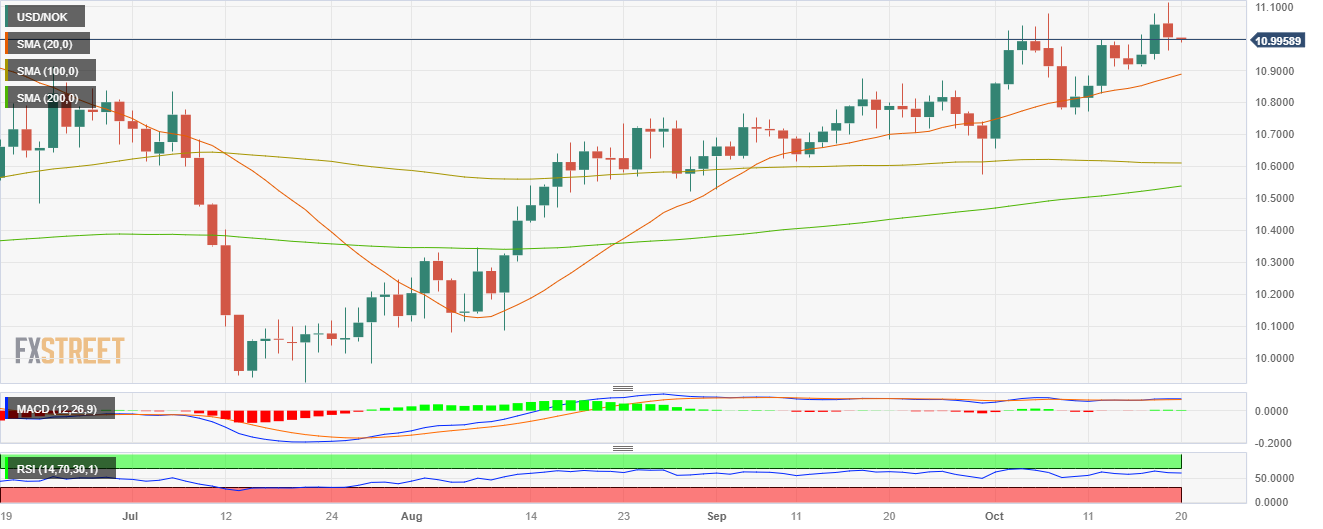
- USD/NOK rose to 11.083, its highest level since June 3 and then closed just below 11.000.
- The USD faced selling pressure following Jerome Powell’s cautious words at the Economic Club of New York.
- The Norges Bank remains hawkish and signalled another hike.
- Jobless Claims from the US came in lower than expected for the second week of October.
In Thursday’s session, the USD/NOK initially rose to multi-month highs at 11.083 and then closed below 11.000 with 0.45% daily losses. On the one hand, the USD weakened against its rivals as investors sensed a dovish stance of Jerome Powell during his speech at the Economic Club of New York. In addition, the upside for the pair remains limited as the Norges Bank stays committed to fighting inflation, and its hawkish stance may strengthen the NOK, analyst at Commerzbank says.
After raising rates in their last September meeting, the Norges Bank signalled another hike in December and its rate projections, now anticipating the policy rate to peak at 4.50%. In addition, the Norwegian bank foresees the policy rate to persist at this level on average until 2024. Furthermore, central bank chief Ida Wolden Bache emphasised the necessity of sustaining a rigorous monetary approach in the foreseeable future, which could limit the upside for the USD/NOK.
On the other hand, the USD weakened after Powell commented that higher bond yields contribute to tighter financial conditions, which would be considered in the next monetary policy meeting. However, markets may have overreacted to those comments as he left the door open for another hike, implying that “meaningful tightening in the pipeline” may still exist. On the data front, during the European session, the weekly Jobless Claims for the second week of October came in at 198,000 vs the 212,000 expected and lower than the previous 211,000.
USD/NOK levels to watch
The daily chart analysis suggests a neutral to bullish outlook for USD/NOK, with the bulls gaining strength. However, challenges persist as the current momentum may not be enough to continue climbing to fresh highs and fundamentals favour the NOK in the near term.
The Relative Strength Index (RSI) has a flat slope above its midline, while the Moving Average Convergence (MACD) histogram shows stagnant green bars. Additionally, the pair is above the 20-, 100-, 200-day Simple Moving Average (SMA), implying that the bulls retain control on a broader scale.
Support levels: 10.950, 10.905, 10.882 (20-day SMA)
Resistance levels: 11.117, 11.170, 11.200.
USD/NOK Daily Chart
