WTI Price Analysis: WTI rallies following soft CPI figures from the US
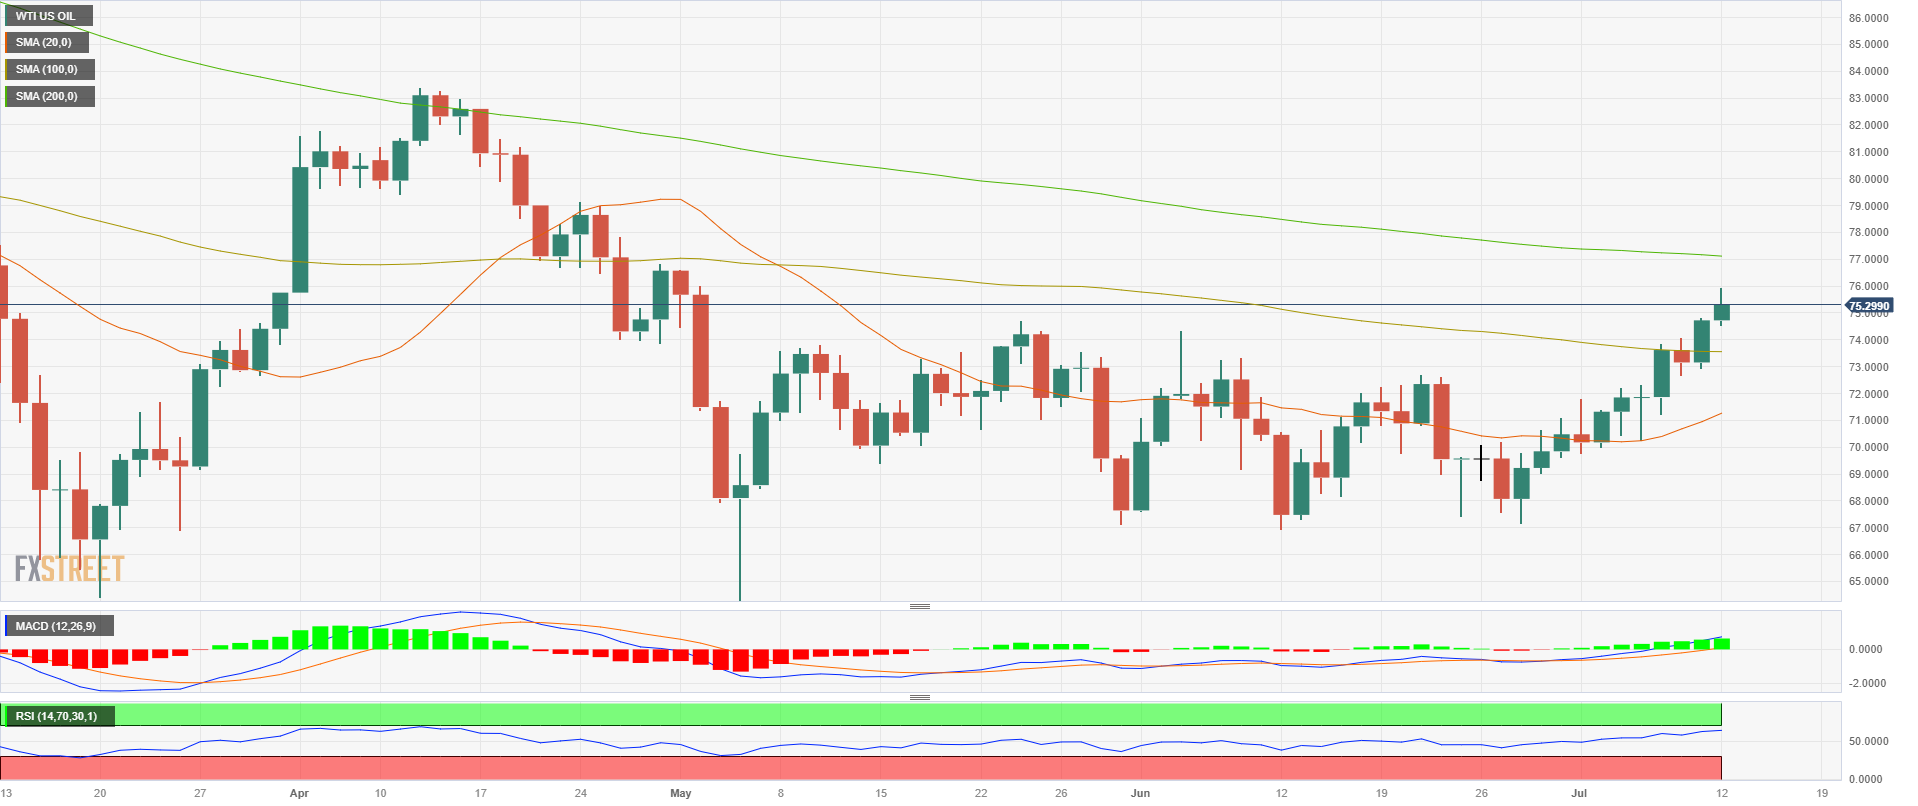
- WTI rose to a high of $76.11 and threatens the 200-day SMA at $77.23.
- US Inflation declined more than the expectations in June.
- Stocks jumped, and US Treasury yields declined following the inflation figures signaling a positive market environment.
On Wednesday, the West Texas Intermediate (WTI) rose to its highest level since May amid a risk-on market environment fueled by soft inflation figures reported by the US. In that sense, the black gold jumped to a daily high of $76.11 en route to test the 200-day Simple Moving Average at $77.23.
The US Bureau of Labor Statistics reported that the US Consumer Price Index declined to 3% YoY vs the 3.1% expected from its last figure of 4%, while the Core inflation fell to 4.8% YoY vs the 5% expected from 5.3%.
As a reaction, US Treasury yields decreased across the board. The 2-year yield declined to 4.72%, the 5-year yield to 4.09% and the 10-year yield to 3.90%, respectively.
Elsewhere, the US main stock indexes are displaying yearly highs. The S&P 500 (SPX) jumped to its highest level since April 2022, while the Nasdaq Composite (NDX) to a high since January 2022. The Dow Jones Industrial Average (DJI) stands near highs not seen since December 2022. In that sense, a positive market environment signalled by rising riskier assets allowed the black gold to advance.
However, investors shouldn’t bet on a dovish Federal Reserve. According to the CME FedWatch tool, a 25 basis points(bps) hike continues to be priced in for the next meeting in July, and another hike this year shouldn’t be taken off the table. Both Jerome Powell and several Fed officials signalled their compromise with price stability and confirmed that they considered appropriate “multiple” hikes for the rest of 2023.
Attention for the rest of the session turns to the release of the Fed’s Beige Book, which will give markets a better outlook on the US economic activity outlook.
WTI Levels to watch
According to the daily chart, the technical outlook is favourable for the WTI. The price consolidated above the 20- and 100-day SMA while the technical indicators are gaining momentum in positive territory.
Resistance Levels: $77.23 (200-day SMA), $78.00, $80.00.
Support Levels: $73.52 (100-day SMA), $71.21 (20-day SMA), $69.00.
WTI Daily chart
