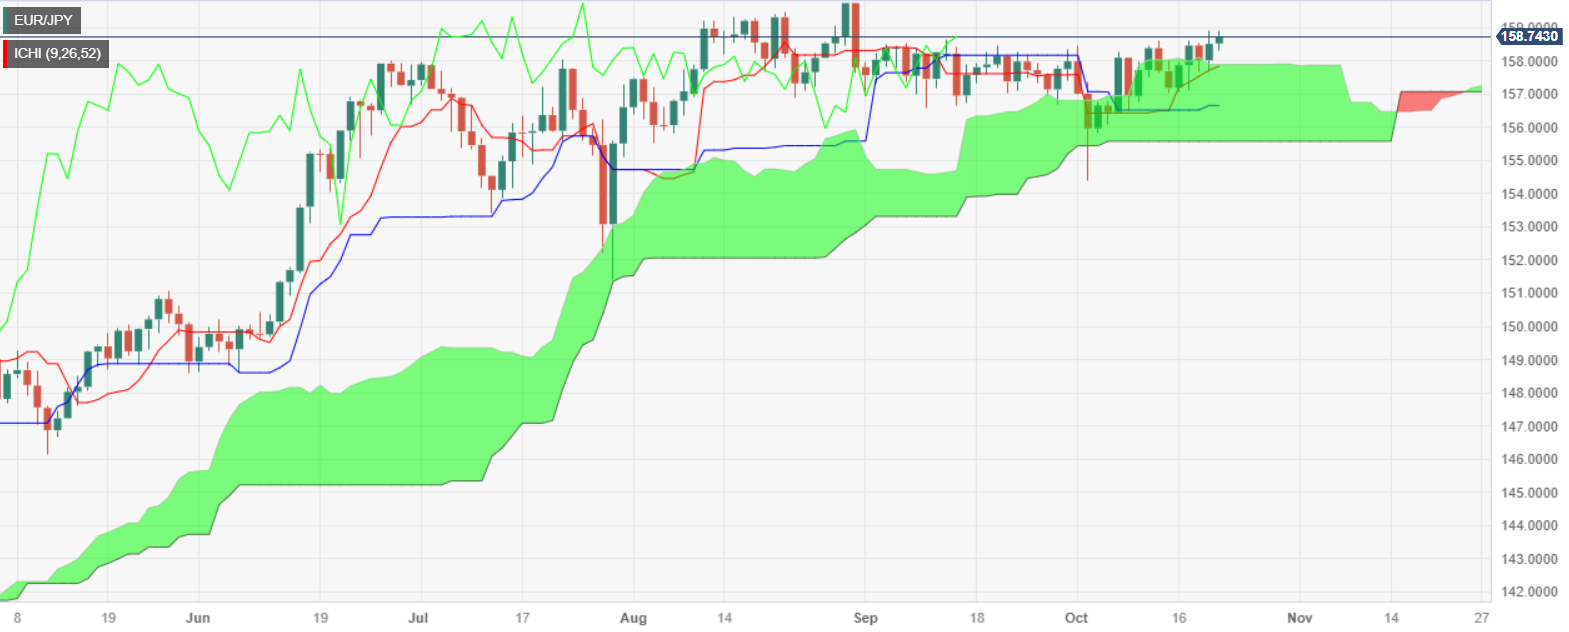
EUR/JPY Price Analysis: Uptrend stalls at 159.00, as buyers target 159.70s YTD high
- EUR/JPY climbs for the second straight day, breaking above 158.92, but closes at 158.74.
- BoJ's ultra-loose monetary policy pressures JPY, while positive EU data reduces a possible ECB rate hike.
- Technical analysis shows potential for further gains, with YTD high at 159.76 as next target for buyers.
EUR/JPY climbed for the second straight day, breaking above last Thursday’s high of 158.92, though it retreated some and printed a daily close of 158.74, registering gains of 0.19%.
The fundamental backdrop has not changed, as risk aversion was the price action driver during the week, while the Bank of Japan’s (BoJ) commitment to its ultra-loose monetary policy pressured the Japanese Yen (JPY). Meanwhile, the Eurozone’s (EU) more positive economic data has pushed aside the likelihood of a European Central Bank (ECB) rate hike, but the Euro (EUR) is not out of the woods yet. Recessionary fears loom, along with inflation twice the ECB’s target, increased speculations for a stagflationary scenario.
From a technical perspective, the EUR/JPY’s lack of clear direction keeps the pair trading sideways, though slightly tilted to the upside. If the cross-pair breaks above 159.00, buyers could test the year-to-date (YTD) high at 159.76.
Conversely, if EUR/JPY sellers moved in, the first support would be the 158.00 figure, immediately followed by the top of the Ichimoku Cloud (Kumo) at 157.75/95. Once cleared, the cross would drip inside the Kumo, indicating sellers gathering momentum, with the next support seen at the Tenkan Sen at 157.85, followed by the Kijun-Sen at 156.64.
EUR/JPY Price Action – Daily chart

EUR/JPY Technical Levels