Silver Price Analysis: XAG/USD hovers above the 200-DMA as buyers gather momentum
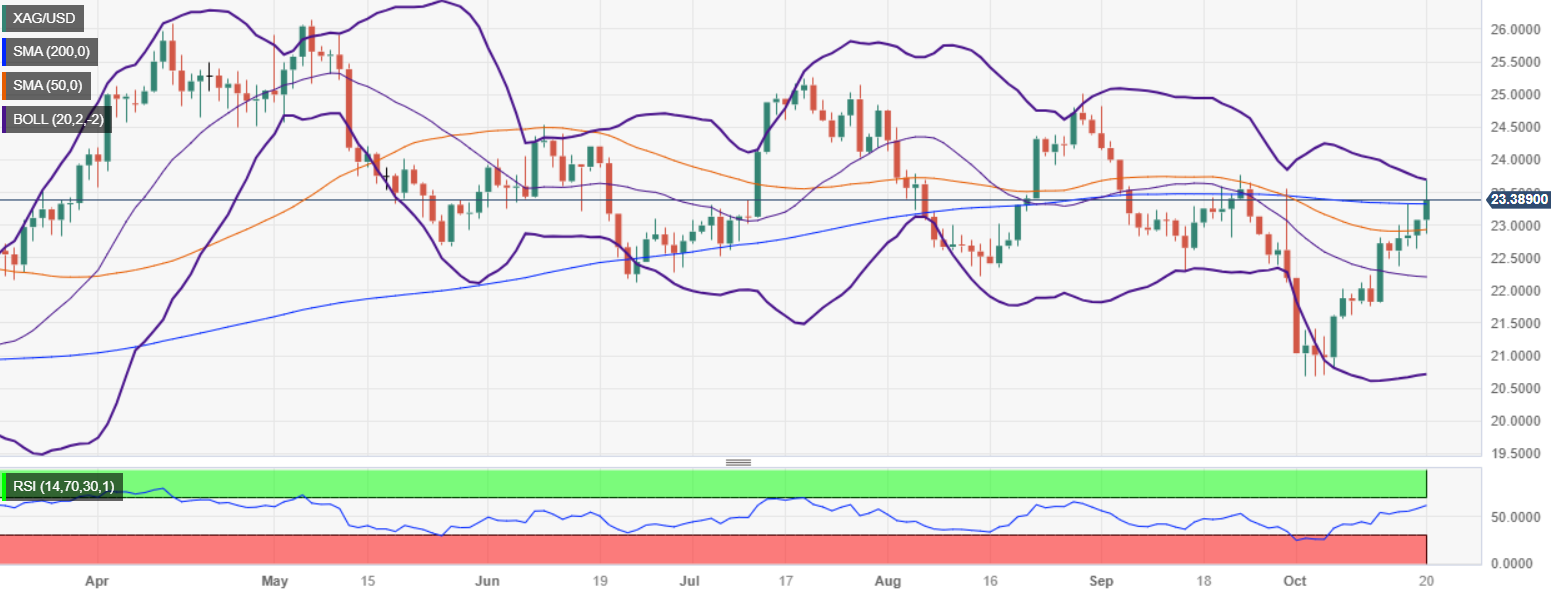
- Silver price tests 200-day simple moving average at $23.38, with daily low/high of $22.88/$23.69.
- For bullish continuation, silver buyers must keep prices above 200-DMA to challenge the $24.00 area.
- If XAG/USD drops below 200-DMA, next support levels are at $23.00, $22.91 (50-DMA), and $22.19 (20-DMA).
Silver price gathers steam and tests the 200-day moving average (DMA) at $23.38 at the time of writing. The XAG/USD hit a daily low/high of $22.88 and $23.69 per troy ounce, but as the Greenback (USD) pares some of its earlier losses, the non-yielding metal struggles to stay above the 200-DMA.
From a technical perspective, as the XAG/USD approached the September 22 high at $23.76, price action was rejected shy of the $23.70 area, as the white metal hit a daily/weekly high before reversing its course above the 200-DMA. For a bullish continuation, Silver buyers must keep prices above the latter to challenge the $24.00 area, but first, they must breach the latest cycle mentioned above.
On the flip side, if XAG/USD drops below the 200-DMA, the next floor would emerge at the $23.00 mark, followed by the 50-DMA at $22.91, and the 20-DMA at $22.19.
XAG/USD Price Action – Daily chart

XAG/USD Technical Levels