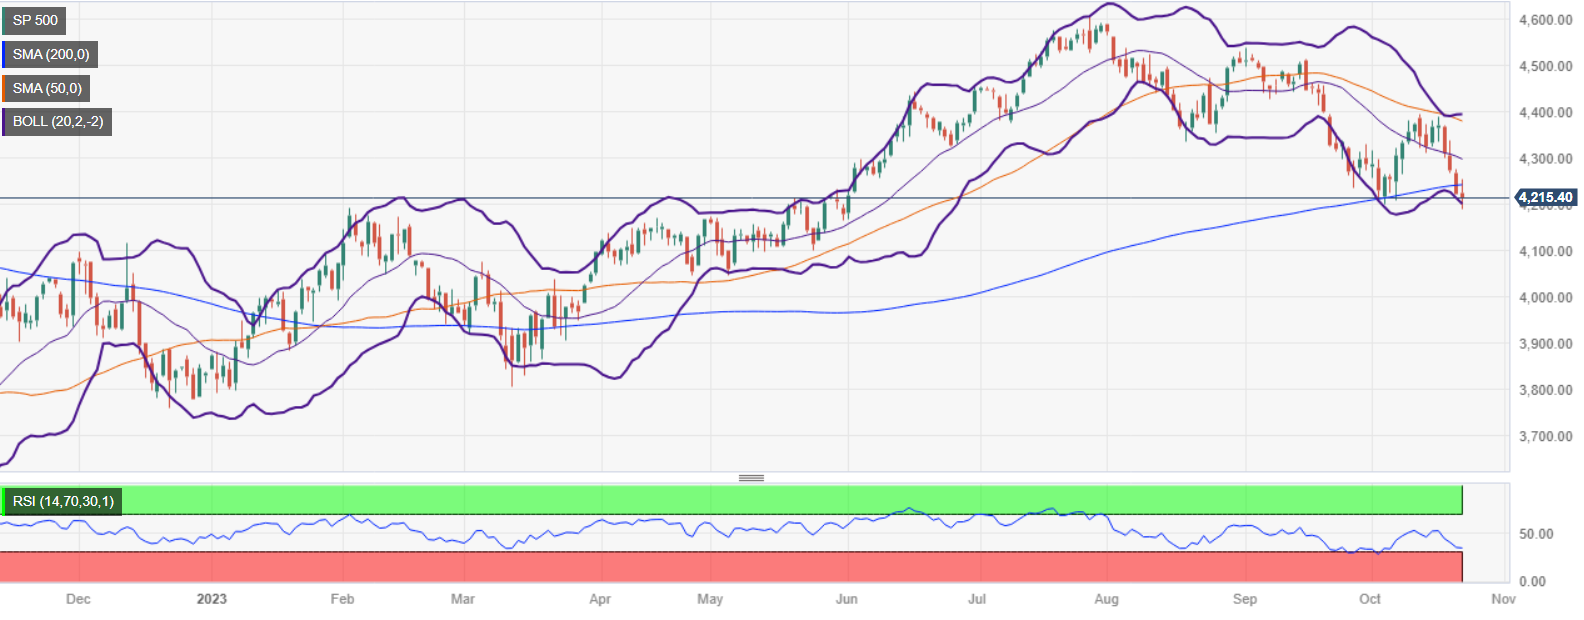
S&P 500 and Dow Jones dip while Nasdaq composite holds gains amid mixed sentiment
- S&P 500 closes at 4217.04, down 0.17%, while Dow Jones loses 0.58%, and Nasdaq gains 0.27%.
- US 10-year benchmark note ends below 5%, contributing to the Greenback's weakening.
- Upcoming economic data includes US New Home Sales, Q3 GDP, and the core PCE, with Federal Reserve officials adopting a more neutral stance on monetary policy.
Wall Street finished the session with losses except for the heavy-tech Nasdaq Composite, which clung to earlier gains. Even though US Treasury bond yields eased since the mid-North American session, a late dip in the S&P 500 and the Dow Jones help sellers to remain in charge
S&P 500 closes down 0.17%, with Communication Services, Technology, and Consumer Discretionary sectors leading gains
On Monday, the S&P 500 closed at 4217.04, down 0.17%, while the Dow Jones Industrial Average hit 32936.41, lost 0.58%. the Nasdaq Composite stood at 13018.33 and printed gains of 0.27%, while the US 10-year benchmark note ended below 5% after reaching that level in the overnight session, though weighed on the Greenback.
Sector-wise, the main gainers were Communication Services, Technology, and Consumer Discretionary, each at 0.72%, 0.42% and 0.21%, respectively. The laggards were Energy, Materials, and Real Estate, down by 1.62%, 1.07%, and 0.84%, respectively.
The US economic docket featured the Chicago Fed National Activity Index, for it was below forecasts of 0.05 at 0.02 but exceeded last month’s slump to -0.22. Ahead of the week, the calendar would feature US New Home Sales, the Gross Domestic Product (GDP) for Q3 on its preliminary reading and the US Federal Reserve’s preferred gauge for inflation, the core PCE.
In the last week, Federal Reserve officials adopted a more neutral stance regarding monetary policy. Despite mentioning that inflation remains too high, they acknowledged that prices are easing, though highlighted the labor market remains tight and below-trend growth is needed to achieve the US central bank's 2% target on inflation.
S&P 500 Daily Chart

S&P 500 Technical Levels